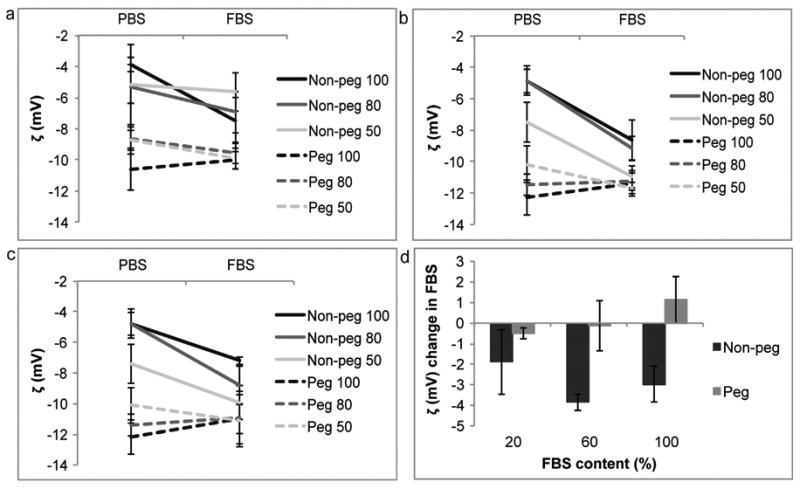
Fig. 6.

Zeta potential (ζ) comparison of liposomes in phosphate buffered saline (PBS) and fetal bovine serum (FBS). Non-pegylated (non-peg) and pegylated (peg) liposomes were extruded through filters with 100 nm, 80 nm and 50 nm pores. (a) 20% FBS, (b) 60% FBS, (c) 100% FBS, (d) summarizing graph. For line graphs data is presented as mean ± SD of 5 measurements. For bar graphs data is presented as mean ± SD of liposomes with different sizes.
