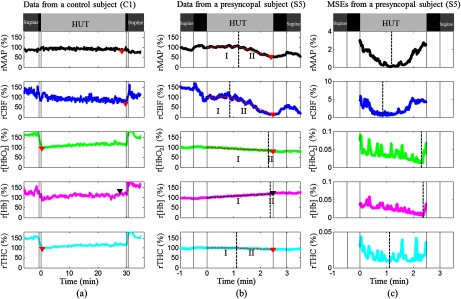
Fig. 1.

MAP and cerebral hemodynamics from a control subject (a) and a presyncopal subject (b), and corresponding MSEs of the two-line linear fittings in a subject with presyncope (c). During HUT, all the measured variables were relatively stable in the control subject (C1) but exhibited two-stage physiological responses in the subject (S5) with presyncope (i.e., slow and gradual changes at Stage I and rapid and dramatic changes at Stage II). The solid vertical lines indicate the beginning and ending of tilting up and tilting down. The triangles indicate the minima of rMAP, rCBF, , and rTHC and the maximum of r[Hb] during HUT. The two connected dashed lines on the top of the raw data (b) demonstrate the two-line fitting results. The dashed vertical lines indicate the breakpoints separating the Stage I and Stage II.
