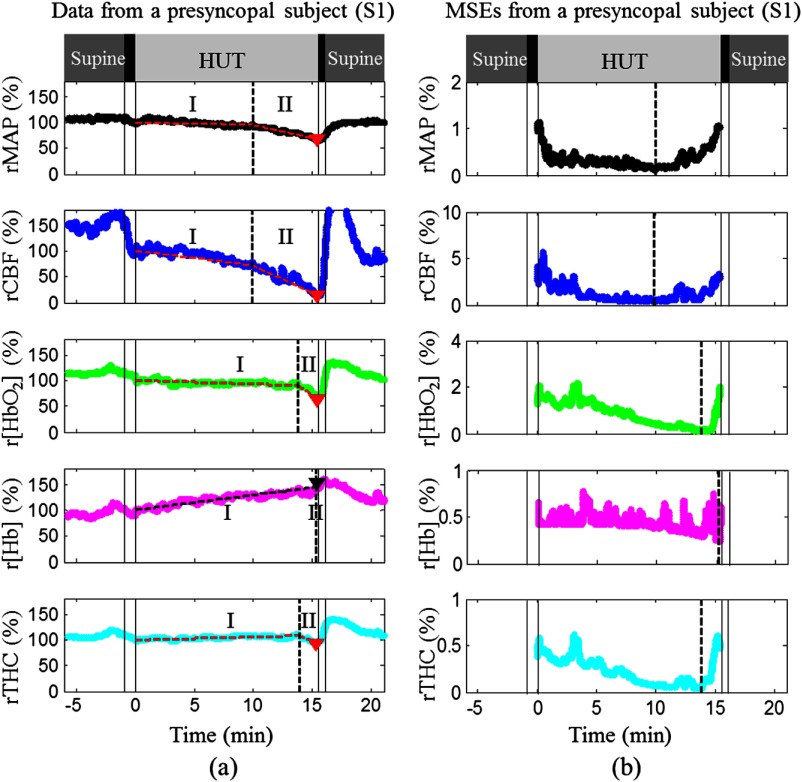
Fig. 2.
MAP and cerebral hemodynamics during HUT (a) and corresponding MSEs of the two-line linear fittings (b) in a subject with presyncope (S1). All symbols and lines in this figure represent the same meanings as those used in Fig. 1. Physiological response trends to HUT in this subject were similar to those shown in Fig. 1(b) although large variations existed between them in terms of how much and how fast these changes were.

