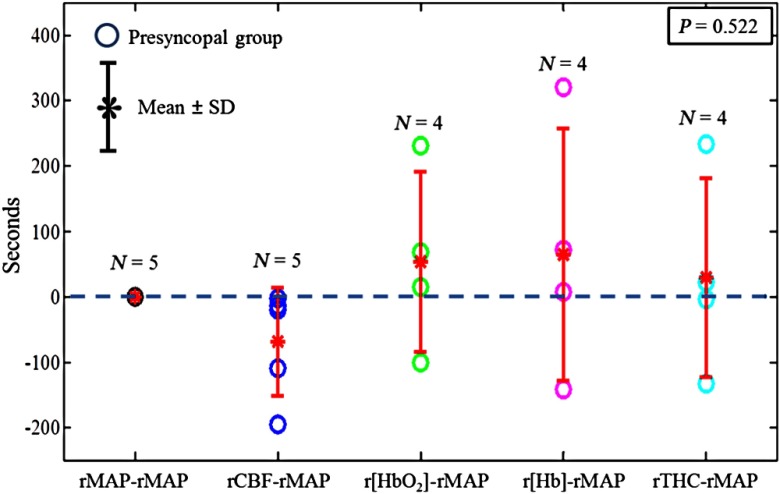
Fig. 4.
Onset time differences at the breakpoints of rMAP, rCBF, , r[Hb], and rTHC relative to rMAP in the presyncopal group. The asteroids with error bars represent the group . The dashed horizontal line represents 0 s. The negative/positive value below/above the dashed horizontal line (0 second) indicates that the breakpoint of cerebral hemodynamic parameters (i.e., rCBF, , r[Hb], and rTHC) occurred earlier/later than that of rMAP.

