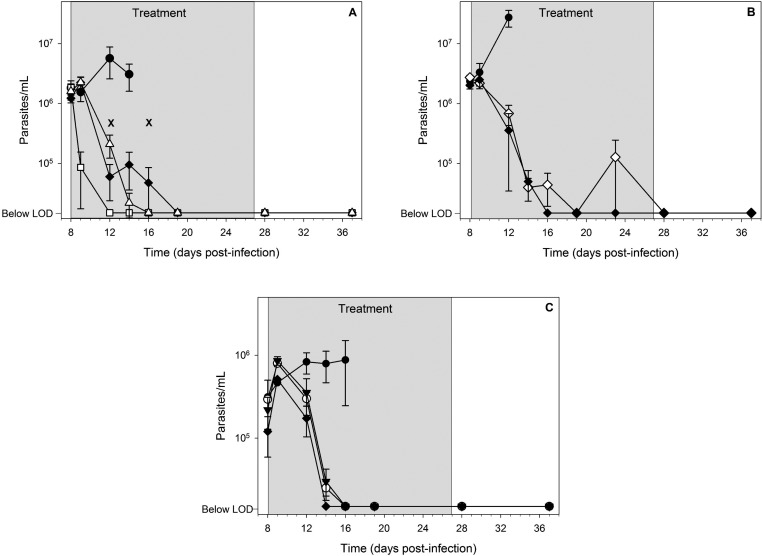
Figure 7.
Efficacy data in T. cruzi infected mice following once daily oral treatment for 20 days beginning on day 8 postinfection. The three panels represent separate experiments, and data points are the mean ± SEM. Symbols represent the following: filled circle (vehicle control, n = 5 in panel A, n = 3 in panels B and C); open square (100 mg/kg benznidazole, n = 5); filled diamond (20 mg/kg posaconazole, n = 5 in panel A, n = 3 in panels B and C); open triangle (20 mg/kg 6, n = 5); open diamond (20 mg/kg (rac)-7, n = 5); filled triangle (5 mg/kg (S)-7, n = 4); open circle (10 mg/kg (S)-7, n = 4). Crosses represent animal deaths (panel A, day 12 (posaconazole), day 16 (compound 6)), and the treatment phase is shown as the gray shaded area. The limit of detection (LOD) of the microscopic method is 20 000 parasites/mL.

