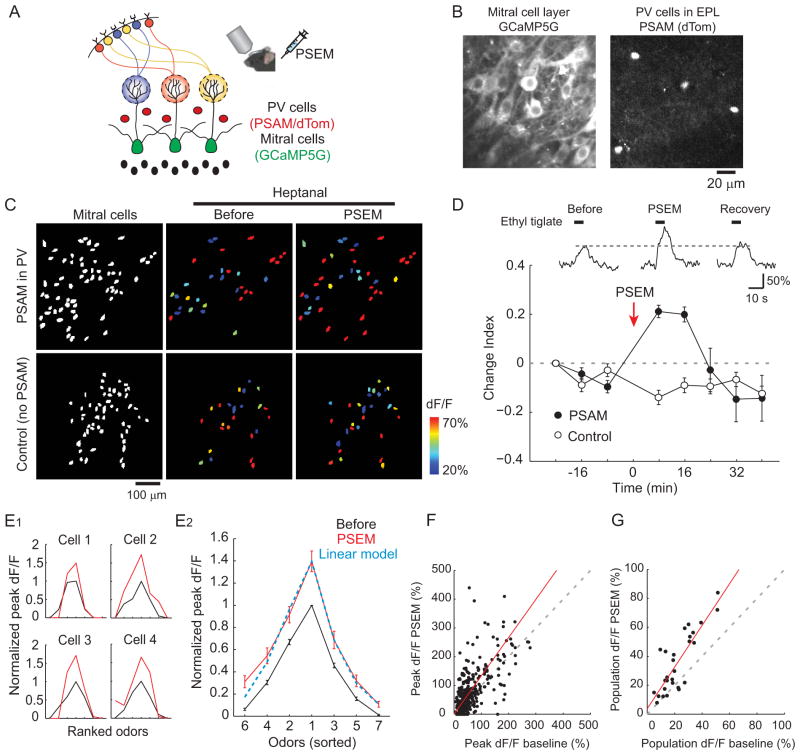
Figure 6. Suppression of PV cells linearly enhances mitral cell odor-evoked activity.
(A) Schematic illustrating mitral cell imaging, with PSAM expressed specifically in PV cells. The PSAM agonist PSEM is injected intraperitoneally to suppress PV cells. (B) Mitral cells and PV cells imaged sequentially from a representative mouse. Left: mitral cells expressing GCaMP5G. Right: PV cells in EPL expressing PSAM and dTomNLS. (C) Activity maps of mitral cell odor-evoked responses before and after PSEM injection. Top: a mouse expressing GCaMP5G in mitral cells and PSAM in PV cells. Mitral cell ensembles respond more strongly to the same odor after PSEM injection. Bottom: same conditions as above, but in a control mouse without viral expression of PSAM in PV cells. PSEM injection has no obvious effect on mitral cell population activity. Left panels, mitral cell ROIs from each animal. (D) Top, odor-evoked responses of a representative mitral cell before and after PSEM injection. Gray dotted line represents the peak response amplitude before PSEM injection. Bottom, change index of mitral cell odor-evoked responses for each trial. PSEM injection transiently increases odor responses of mitral cells in PSAM-expressing mice (filled circles, n = 4 mice, 146 cells), while having no effect on responses from non-expressing control mice (open circles, n = 4 mice, 147 cells). Error bars represent SEM. (E) PV cell suppression enhances mitral cell activity in a multiplicative manner without altering odor preferences. (E1) Tuning curves of four representative cells from PSAM-expressing mice. Odors were ranked for each cell according to the response amplitude during baseline trials. Black: three trials before PSEM injection. Red: three trials immediately after PSEM injection. (E2) Tuning curves averaged across all cells from PSAM-expressing mice that showed responses to at least three out of seven tested odors (n = 67 cells, 4 mice). Blue dotted line represents a curve based on linear transformation (1.30 × original response + 0.09). The equation was determined using the maximum and minimum values of the experimental data. (F) Peak response amplitudes under control conditions (‘baseline’, before PV cell inactivation) plotted against response amplitudes during PV cell inactivation for all cell-odor pairs which were judged as responsive during control conditions (n = 366 cell-odor pairs). Linear regression fit (red; not forced to the origin) yields a slope greater than one and intercept close to zero, indicating a linear enhancement of mitral cell responses during PV cell inactivation. Gray dotted line: unity. (G) Relationship between mitral cell population activity (population dF/F) before and during PV cell inactivation (n = 28 mouse-odor pairs) indicates a linear transformation (linear fit with slope >1 and intercept near zero) of population activity during PV cell inactivation. Red line: linear regression, gray dotted line: unity.

