
Figure 2.
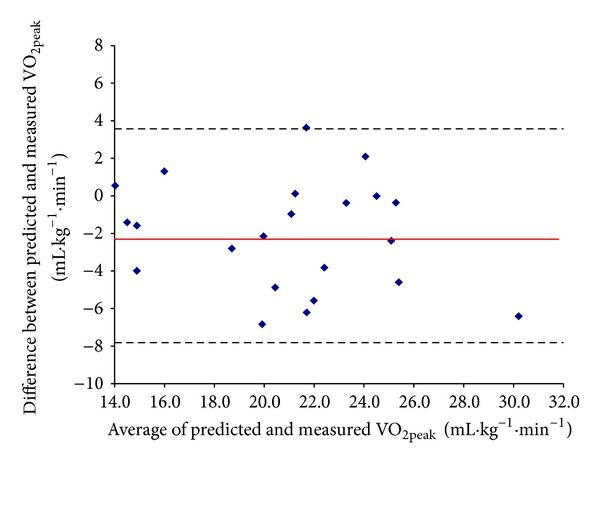
Bland-Altman plot of measured during the cycle test and predicted by the Siconolfi step test (visit 2). The mean bias is represented by the solid line and the 95% limits of agreement are represented by the dashed lines.
Official websites use .gov
A
.gov website belongs to an official
government organization in the United States.
Secure .gov websites use HTTPS
A lock (
) or https:// means you've safely
connected to the .gov website. Share sensitive
information only on official, secure websites.
Bland-Altman plot of measured during the cycle test and predicted by the Siconolfi step test (visit 2). The mean bias is represented by the solid line and the 95% limits of agreement are represented by the dashed lines.