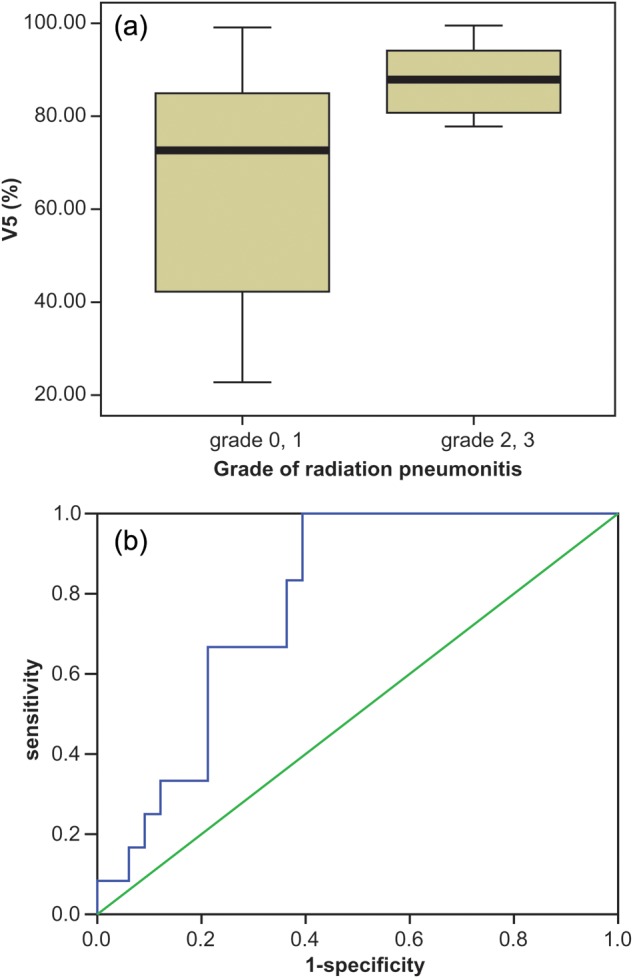
Fig. 1.

The box plot and ROC curve of V5 relative to the development of Grade 0–1 and Grade 2–3 RP. (a) The box plot shows that the values of the mean ± standard deviation for V5 were (65.65 ± 24.02)% and (87.73 ± 7.47)% for Grade 0–1 and Grade 2–3 RP, respectively. This difference was statistically significant in both univariate (P = 0.003) and multivariate analysis (P = 0.019). (b) The ROC curve of V5 yielded 0.780 of the AUC (area under curve), and this was statistically significant (P = 0.004). V5 was the most powerful predictor of the pulmonary dosimetric parameters, including mean lung dose and Vn (volume of percentage of tumor-free normal lung receiving ≥n Gy).
