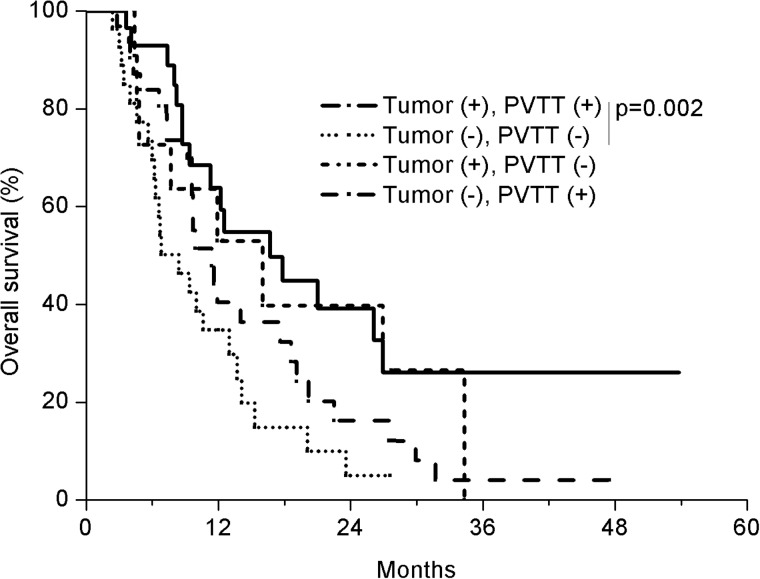
Fig. 2.
Overall survival (OS) of four patient groups according to the tumor and PVTT response (CR + PR). The group that showed a response both in PVTT and tumor had the longest OS (n = 30; median, 16.7 months), which contrasted to OS in the group that showed response neither in tumor nor in PVTT (n = 27; median, 8.4 months). The OS difference in the two groups was statistically significant (P = 0.002, Log rank test), The OS in other groups, one showing a response in the tumor alone (n = 11; median, 16.0 months) and the other showing a response in the PVTT alone (n = 32; median, 11.4 months) was similar.

