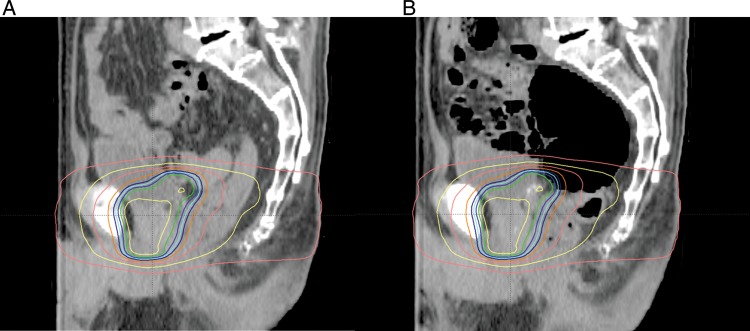
Fig. 4.

An example of the impact of rectal gas on the prostate position in the prone fixation. (A) Sagittal view of simulation CT with dose distribution curves. (B) Sagittal view of follow-up CT superimposed on dose distribution curves at planning. Although a large amount of rectal gas exists, the prostate dose was maintained because most of the gas is located in the rectosigmoid region of the rectum.
