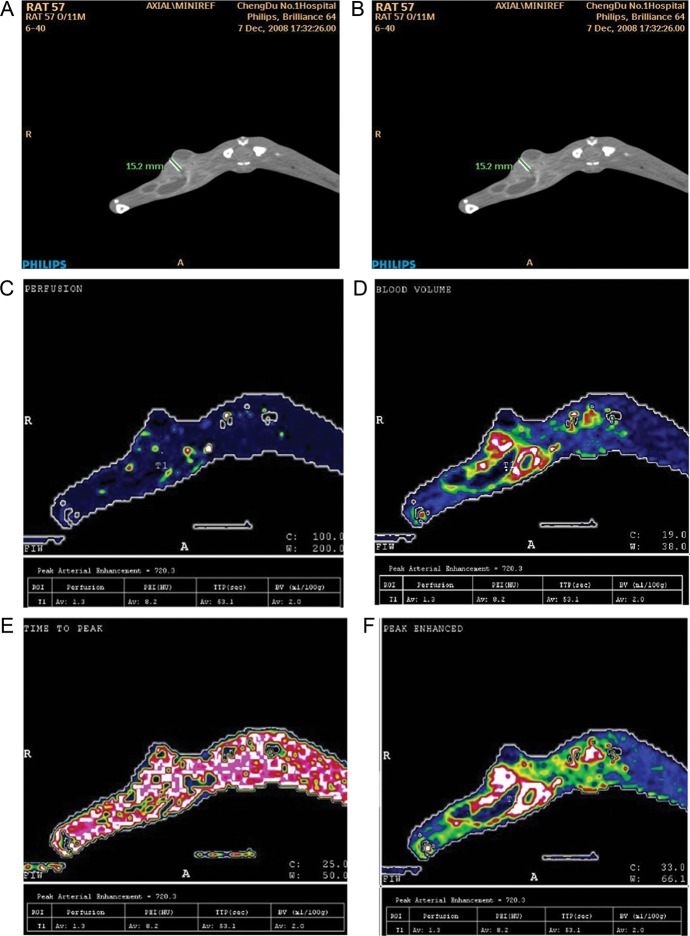
Fig. 3.
Measurement of PO2 and acquisition of functional parameters of the same region of interest in one animal; PO2 < 5 mmHg. (A) PO2 at region of interest was 0.75 mmHg as measured by the oxygen electrode; (B) based on Figure 1, corresponding regions of interest are selected in the same layer of the original image; (C) perfusion map perfusion = 1.3 ml/min/ml); (D) blood volume map BV = 2.0 ml/100g); (E) time to peak map TTP = 53.1 sec) (F) peak enhancement intensity map PEI = 8.2 HU.

