
Figure 7.
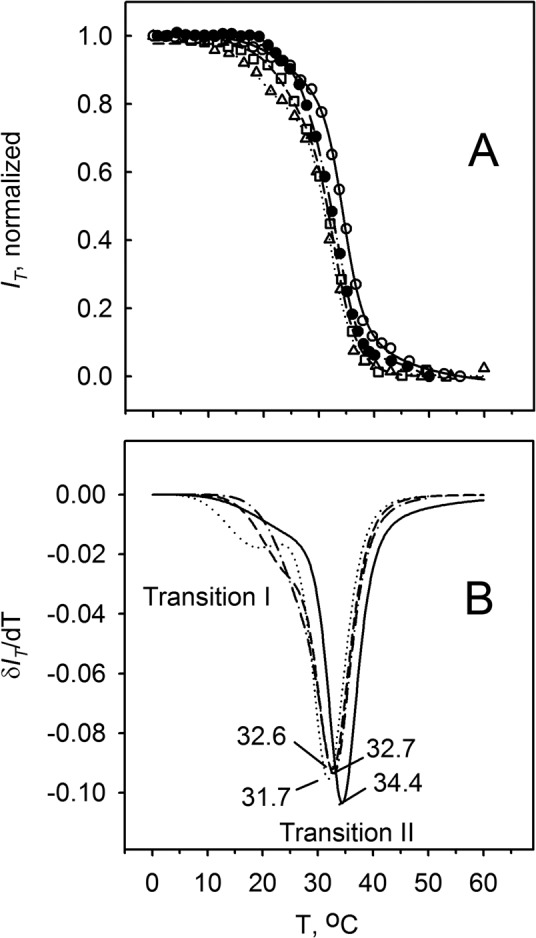
Melting curves of the mouse meibum in the meibomian ducts. Results obtained for four tissue slides from four different mice are shown. No compensator was used. (A) Raw melting curves. (B) First derivatives of the curves shown in (A). Differentiation shows the presence of a shoulder at lower temperatures, which is indicative of an additional phase transition (or pretransition) in the temperature range of 10°C to 25°C.