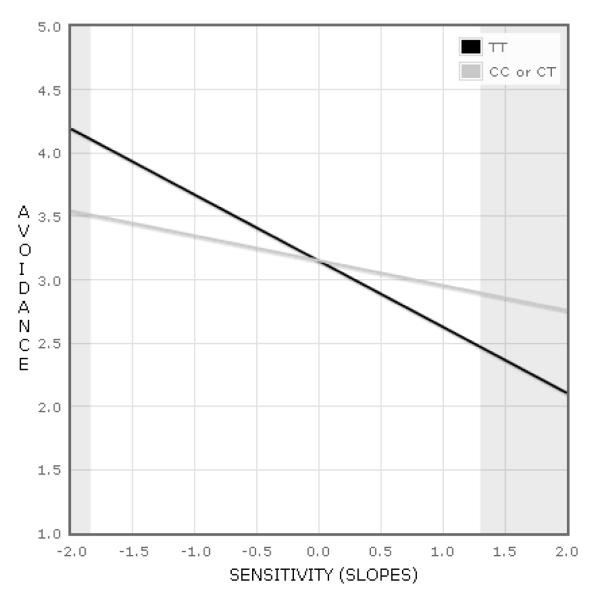
Figure 2.
Gene (HTR2A) by environment interaction (maternal sensitivity slopes) in the prediction of romantic avoidance. Shaded gray areas represent regions of significance (i.e., ranges of standardized sensitivity slopes at which the genotype groups were significantly different with respect to romantic avoidance). The regressions of avoidance on changes in sensitivity were significant for both genotype groups.

