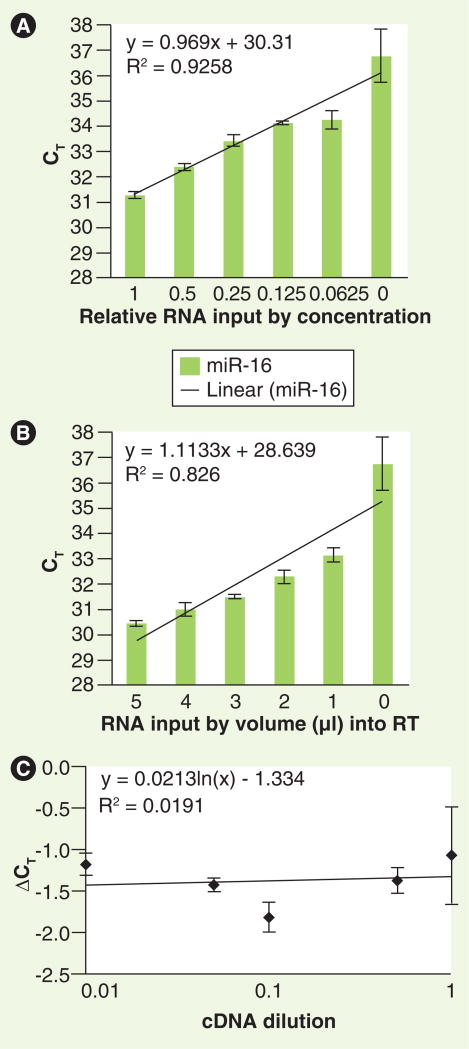
Figure 2. Relative quantitation of urinary miRNA is reflected by cycle threshold values.
Total RNA was isolated from one normal subject and was added to the RT reaction at: (A) various concentrations via serial dilutions of RNA by adding nuclease-free water; or (B) various volumes of the same RNA. Subsequently, miR-16 was quantitated from these reactions as described in the ‘Materials & methods’ section. Error bars indicate standard deviation. (C) Target (miR-16) and reference (U6) amplifications were performed, at the cDNA dilutions indicated, from a single urine sample. The change in CT value between miR-16 and U6 at each cDNA dilution (ΔCT) is shown.
CT: Cycle threshold; RT: Reverse transcription.

