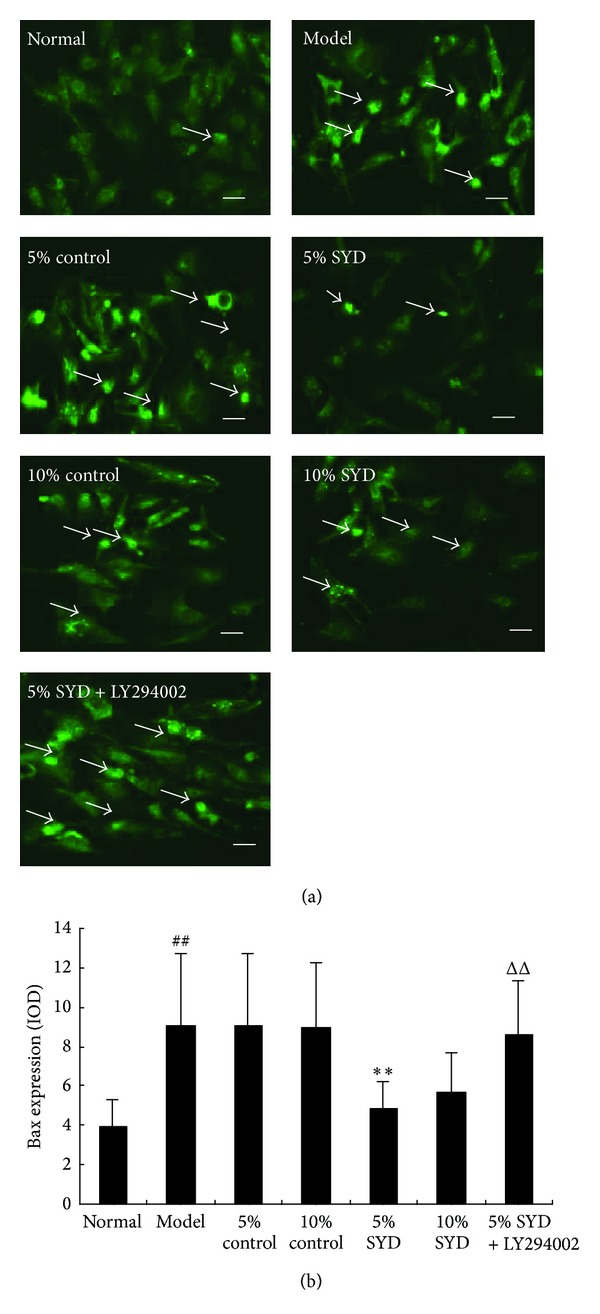
Figure 6.

Effects of SYD and LY294002 on Bax expression. (a) Representative images of Bax staining. (b) Quantitative analysis of Bax expression (IOD). The cells were exposed to 6 hours of normoxic culture (normal), 2 hours of hypoxia followed by 4 hours of reoxygenation (H/R), and postconditioning with two concentrations of SYD or control serum (5% or 10% each). In some experiments, 5% SYD was complemented with LY294002 (5% SYD + LY294002). Data are expressed as mean ± SEM (n = 3). ## P < 0.01 versus normal, **P < 0.01 versus 5% control serum, ΔΔ P < 0.01 versus 10% SYD, and ☆☆ P < 0.01 versus 5% SYD. Scale bar represents 50 μm.
