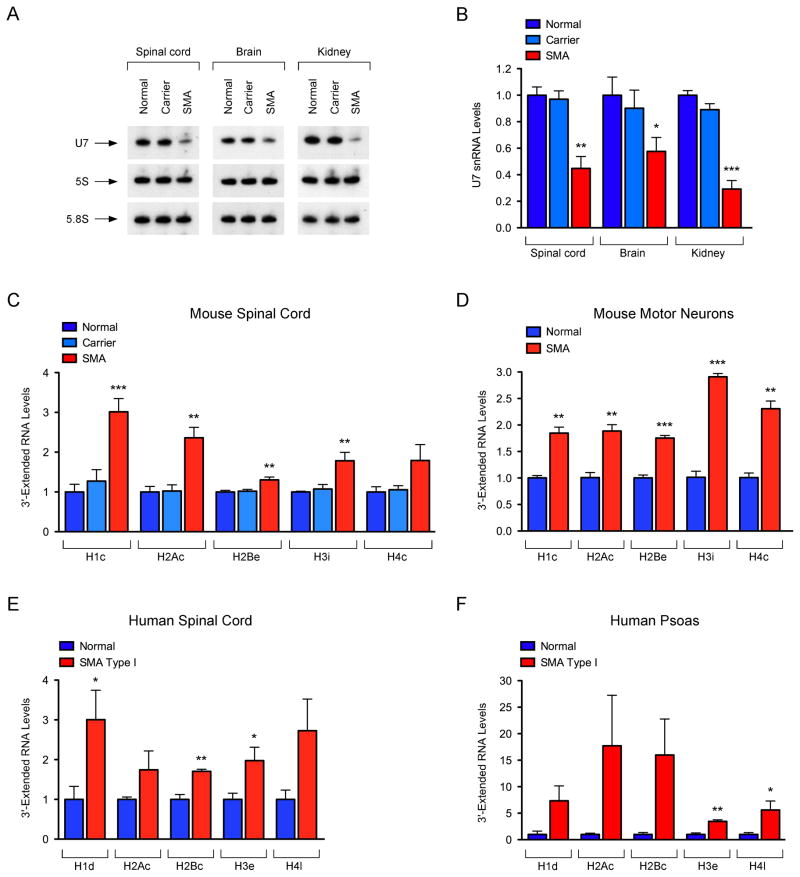
Figure 4. Disruption of U7 snRNP biogenesis and histone mRNA 3′-end formation in SMA.
(A) Northern blot analysis of U7 expression in tissues from normal, carrier and SMA mice at P6. (B) Quantification of U7 levels normalized to 5S rRNA from three independent experiments as in (A). (C) RT-qPCR analysis of 3′-extended histone mRNAs in spinal cord from normal, carrier, and SMA mice at P6. (D) RT-qPCR analysis of 3′-extended histone mRNAs in LCM motor neurons from normal and SMA mice at P6. (E) RT-qPCR analysis of 3′-extended histone mRNAs in the spinal cord from controls (n=3) and SMA patients (n=4). (F) RT-qPCR analysis of 3′-extended histone mRNAs in the psoas from controls (n=3) and SMA patients (n=4).
Data in all graphs are represented as mean and SEM. See also Figure S3.

