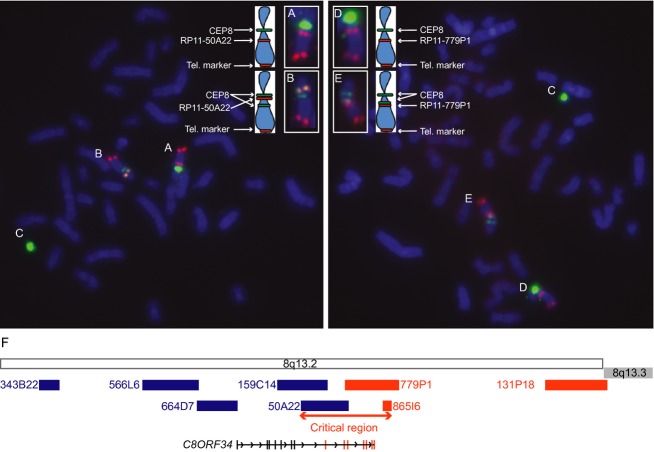
Figure 4.
FISH analysis of the proband's lymphoblasts. FISH from two cells with cohybridization of CEP8 centromere probe (green), a telomeric BAC probe for chromosome 8 (tel. marker; red) and BAC probes RP11-50A22 (red, left photo) or RP11-779P1 (red, right photo). Chromosomes A, B, D, and E are enlarged and accompanied by schematics in the upper aspect of the figure. (Chromosome A) A normal chromosome 8 (chr.8) shows the expected signal pattern for RP11-50A22. (Chromosome B) An inv(8) chromosome shows a split CEP8 signal (green) with the RP11-50A22 signal (red) falling between the split CEP8 green signals, consistent with its inversion. This places the BAC centromeric to the inversion breakpoint. (Chromosomes C) The mosaic chromosome 8 marker in each cell contains a CEP8 signal. (Chromosome D) A normal chromosome 8 (chr.8) shows the expected signal pattern for RP11-779P1. (Chromosome E) An inv(8) shows the split CEP8 signal (green) and an intact red signal for RP11-779P1 telomeric to the split CEP8 signal, consistent with its normal orientation. (F) Schematic of the location of the BAC probes along 8q13.2. BAC probes denoted in blue were inverted, while BAC probes denoted in orange had a normal orientation. Thus, the translocation breakpoint falls within the region defined by the start of RP11-50A22 and the end of RP11-865I6.2. This critical region (∼293 Kb) encompasses C8ORF34 on 8q13.2.

