Figure 5.
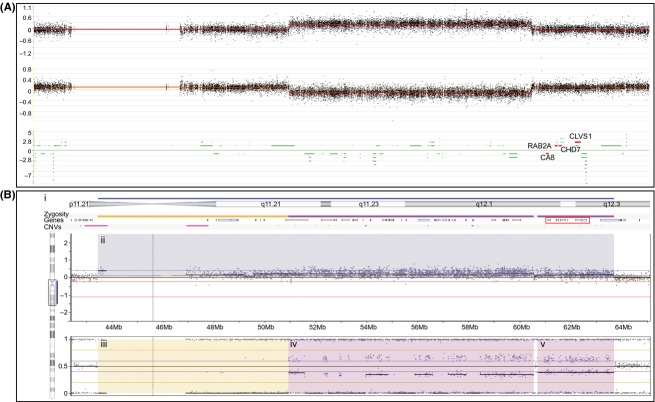
CMA results of chromosome 8 pericentromeric region and q arm using two different array platforms. (A) Nimblegen custom CGH oligonucleotide microarray reveals a copy gain spanning 8q11.2-q12.1 containing 38 genes (hg19: chr8:51,490,197-60,554,196). This duplication does not include the genes involved in the critical region of 8q12 microduplication syndrome CA8, RAB2A, CHD7, and CLVS1 highlighted in red. (B) CMA result of chromosome 8q11.21-q12.3 using the Illumina HumanOmniExpress SNP-based array as interpreted by Nexus 7.0. (B-i) Schematic of the chromosomal region annotated from top to bottom as follows: blue bar denotes the region shaded blue in the Log R ratio plot in (B-ii); schematic of chromosomal banding; yellow and purple zygosity bars denote the regions shaded yellow and purple in the B-allele frequency (BAF) plot in (B-iii–v); schematic of genes within the region with CA1, RAB2A, CHD7, and CLVS1 boxed in red; pink bars denote common CNVs. (B-ii) Log R ratio plot in which each black dot represents the log intensity of the corresponding SNP. The region highlighted in blue is consistent with a copy gain. (B-iii–v) BAF plot in which the black dots represent the genotype calls of the SNPs in (B-ii). SNPs that plot at either 0 or 1 are homozygous, SNPs that plot at 0.5 are heterozygous, while SNPs that plot at 0.33 and 0.66 have an allelic imbalance. (B-iii) Yellow rectangle highlights SNPs from 43.5 to 51 Mb with LOH (aside from five SNPs showing the pattern of allelic imbalance). The combined information from the overlapping Log-R-ratio and BAF plots is atypical for copy gains and might reflect a UPD. (B-iv and v) Purple rectangles highlight SNPs from 51 to 63.5 Mb with allelic imbalance which is characteristic of a copy gain. The drop in the Log R ratio between B-iv and B-v may reflect a reduction in the level of mosaicism.

