Figure 3.
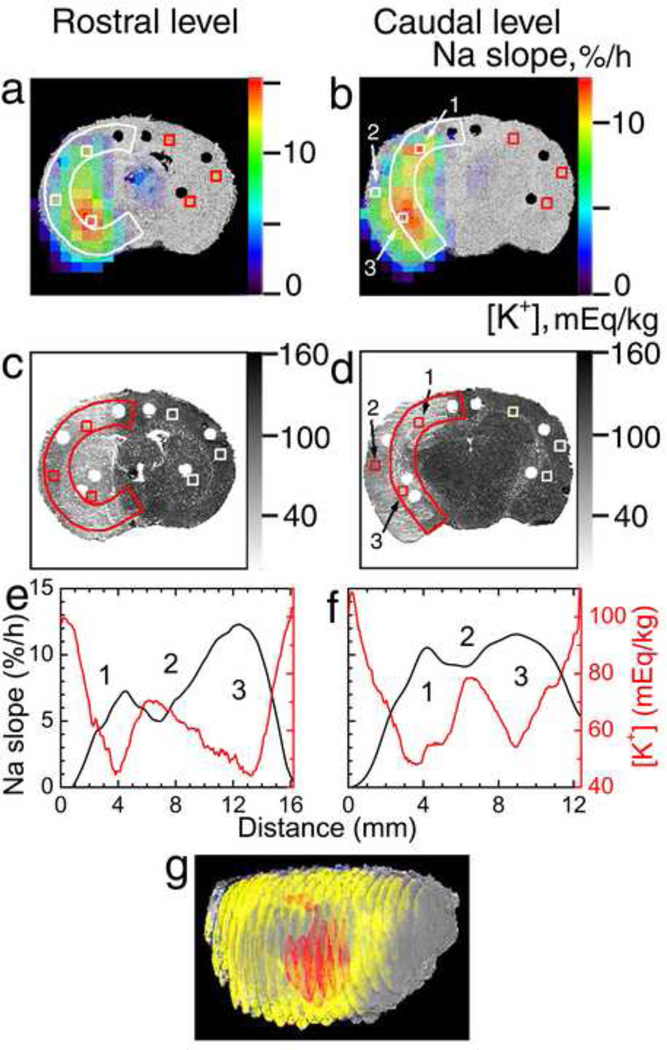
Na+ and K+ mapping of the ischemic brain (rat #5). (a,b) Pseudocolor images of the 23Na slope superimposed over the grayscale 3D reconstruction of the brain from histological 35-µm-thick sections. (c,d) K+-stained slices cut at 4.4 h post MCAO. (e,f) 23Na slope (black) and [K+]br (red) profiles along the ribbons in the ischemic hemisphere (white or color arcs in (a)–(d)) in the dorsal-to-ventral direction. The coronal sections were taken at the rostral (bregma −0.4 mm, a,c,e) and caudal (bregma −3 mm, b,d,f) levels. (1) Dorsal ischemic edge; (2) central ischemic core; (3) ventral ischemic edge. Estimated [Na+] and [K+] in ipsilateral and homotopic contralateral ROIs (white or color squares in (a)–(d)) in regions 1–3 are given in Table 3. (g) 3D reconstruction of the brain from 21 co-registered K+-stained coronal slices (0.7-mm separation) as viewed from the front-right perspective. Regions with [K+]br below 48 ± 4 mEq/kg (based on Gaussian-filtered images, to improve low-K+ ROI contiguity) are shown in yellow to highlight the peripheral ischemic core surrounding the central ischemic core. ROI of maximum 23Na slope corresponding to the slope range of 11.4 to 15.6%/h and overlapping the low-K+ ROI is shown in red.

