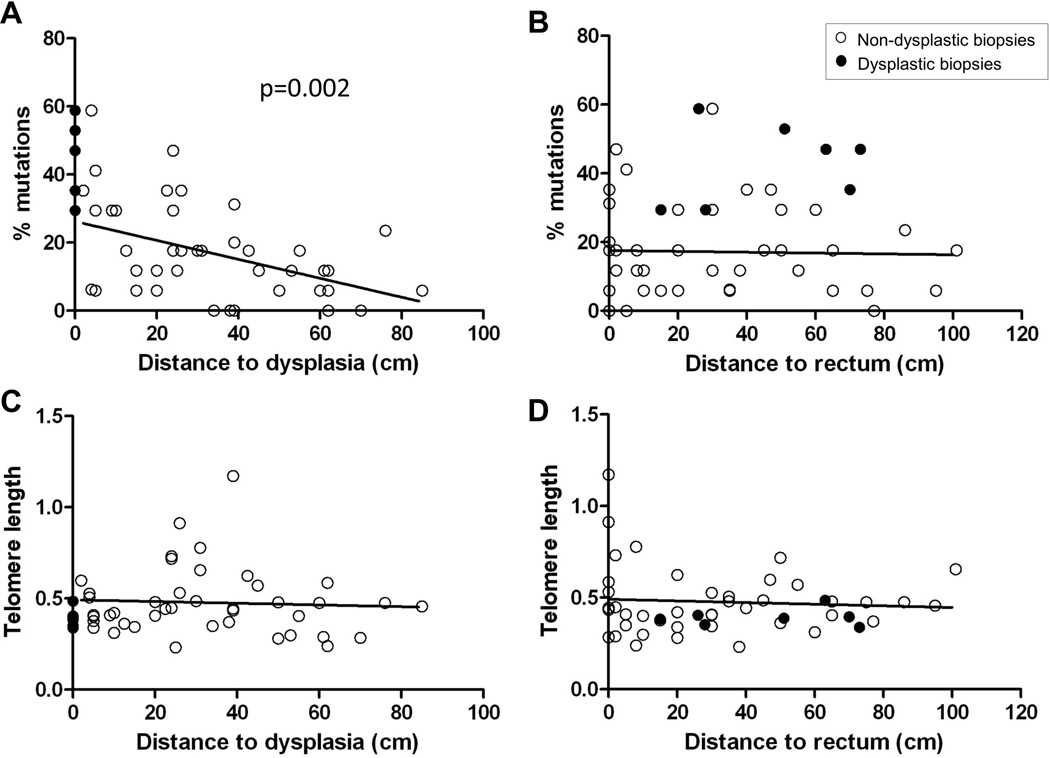
Figure 4. Associations of clonal expansions and telomere length with distance to dysplasia and rectum.
Regression plots of percentage of mutations and distance to dysplasia (A), percentage of mutations and distance to rectum (B), telomere length and distance to dysplasia (C), and telomere length and distance to rectum (D). Open circles: non-dysplastic biopsies; black circles: dysplastic biopsies. Dysplastic biopsies are not included in the regression tests. Statistically significant p-value for the GEE regression test in A is indicated.

