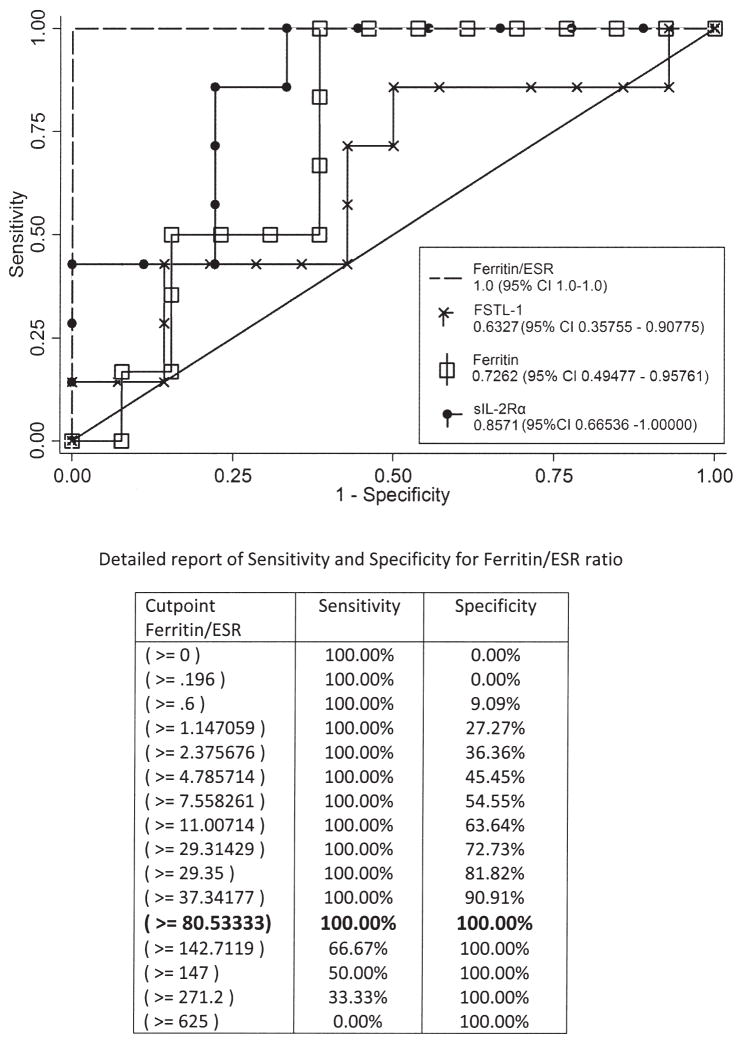
Figure 3.
Receiver-operating characteristics (ROC) curve shows an optimal sensitivity and specificity for MAS, obtained by use of ferritin/ESR ratio. Comparison of ROC curves with other biomarkers is shown; table gives details of ferritin/ESR sensitivity and specificity. A cutpoint of ferritin/ESR ratio of 80 provides optimum sensitivity and specificity for MAS, as shown in the detailed analysis. MAS: macrophage activation syndrome; ESR: erythrocyte sedimentation rate; FSTL-1: Follistatin-like protein 1; sIL-2Rα: soluble interleukin-2 receptor-α.

