Figure 1.
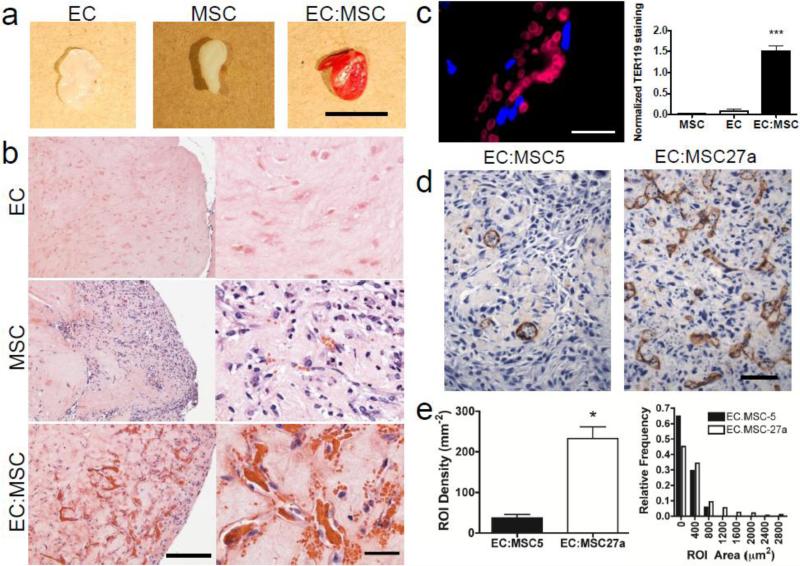
Cross-talk between human endothelial cells (ECs) and human mesenchymal stem cells (MSCs) promotes the formation of vascular networks in engineered tissue and perfused blood vessels in vivo.
a, Gross photographs of whole gel explants at 7 days illustrate significant vascularization of gels containing both cell types by the visible red color in EC:MSC explants (right). Scale bar: 5 mm. b, Representative hematoxylin & eosin (H&E) stainings of collagen/fibronectin gel explants after 7 days in vivo show minimal vascularization in implants containing either human ECs (top) or human MSCs (middle). Significant vascularization is observed in implants containing a mixture of the two cell types (bottom) in a 1:1 ratio, where 1×10⁶ total cells were implanted per condition. Scale bar: 200 μm, left; 40 μm, right. c, Red blood cell content in vascularized EC:MSC gel plug, measured by immunostaining against TER-119 (red), is significantly increased in EC:MSC plugs as compared to either cell type alone (p<0.001). Scale bar: 20 μm. Quantification of TER-119 positivity is normalized to the number of DAPI-positive nuclei within each high power field (n=18 (MSC), n=4 (EC), n=16 (EC:MSC)). d, Immunostaining against CD31 (brown, DAB) in representative scaffold-free engineered tissues after 8 days of in vitro culture containing ECs plus either MSC27a or MSC5 cells shows greatly increased EC networks with MSC27a co-culture. Scale bar: 100 μm. e, Quantification of in vitro vascularization in engineered tissues by automated detection of regions of interest (ROI) from brown CD31 stain shows increased vascular density (left) and a broader spectrum of structure sizes (right, assessed by individual ROI areas and plotted as a histogram). ROI density is defined as the total number of ROI per area (mm2). ROI area (μm2) indicates the area of each ROI outlined (see Supplementary Fig. 1) and is binned and plotted as a relative frequency of the total number of structures (defined as 1.0). The ROI area is a surrogate measure for vessel diameter.

