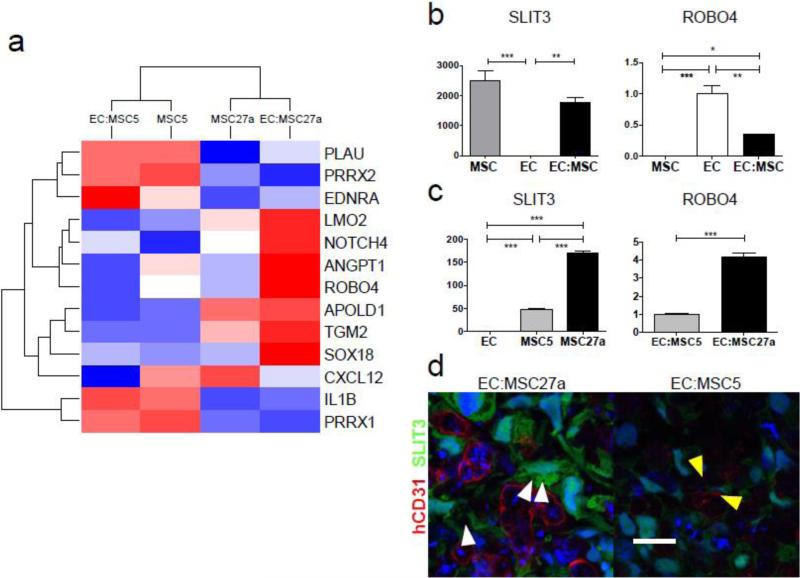
Figure 4.
Whole genome microarray revealed seven genes strongly upregulated during MSC-mediated vascular development in engineered tissue and led to identification of SLIT3/ROBO4 as a leading candidate pathway.
a, Microarray gene expression profiling of cultured MSC clones (MSC5 and MSC27a) and in vitro scaffold-free engineered tissues EC:MSC5 and EC:MSC27a was used to identify 13 genes changing >8-fold in EC:MSC27a versus EC:MSC5 engineered tissues and associated with gene ontology terms “blood vessel morphogenesis”, “blood vessel development”, and “vasculature development” (P-values < 0.003 and annotation cluster enrichment score of 2.5) by DAVID functional annotation clustering analysis. Scale is as in Fig. 3a and demonstrates that 7 genes are strongly upregulated in the vascular EC:MSC27a engineered tissues (red color), including ANGPT1, NOTCH4, and ROBO4. b, SLIT3 and ROBO4 mRNA expression by qPCR after 48 hours in vitro culture of MSCs, ECs, or 1:1 combination of the two cell types demonstrates MSC-specific expression of SLIT3 and EC-specific expression of ROBO4 (n=3 per group; ***P<0.001, **P<0.01, and *P<0.05). c, SLIT3 mRNA expression by qPCR is significantly higher in MSC27a cells compared to MSC5 cells (n=3 per group; ***P<0.001). Further, ROBO4 mRNA expression is more than four-fold higher in EC:MSC27a as compared to EC:MSC5 engineered tissues (n=3 per group, ***P<0.001). d, Engineered vascular tissue in vitro shows ample SLIT3 (green) in EC:MSC27a tissues (left) and reduced SLIT3 in EC:MSC5 tissues (right; confocal images taken with same laser settings). SLIT3-positive MSC27a cells extend processes (white arrowheads) toward human CD31-positive ECs (red) in a pericyte-like manner. No overlap between SLIT3 and hCD31 signals suggests that only MSC27a cells produce SLIT3. The surviving endothelial cells in EC:MSC5 tissues may be supported by MSCs expressing low levels of SLIT3 with projections towards the ECs (yellow arrowheads). Scale bar: 20 μm.

