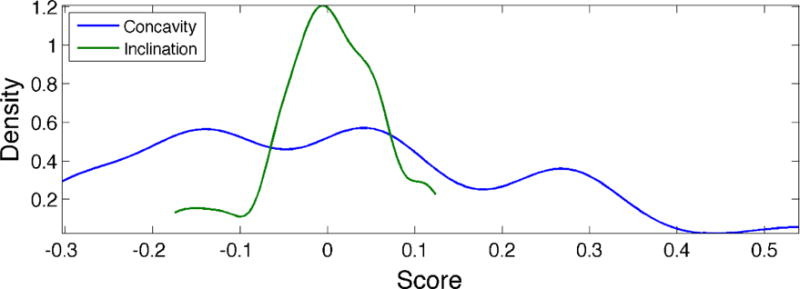
Figure 8.

Distribution of posterior pharyngeal walls according to the three largest modes of shape variation. Abscissa values represent scores derived from PCA, with a value of 0 representing the pharyngeal wall mean shape. Modes accounting for more of the variance in the data (e.g., concavity) display a broader distribution. The presence of multiple modes, such as that exhibited by concavity, indicates that pharyngeal wall shapes may naturally separate into categories.
