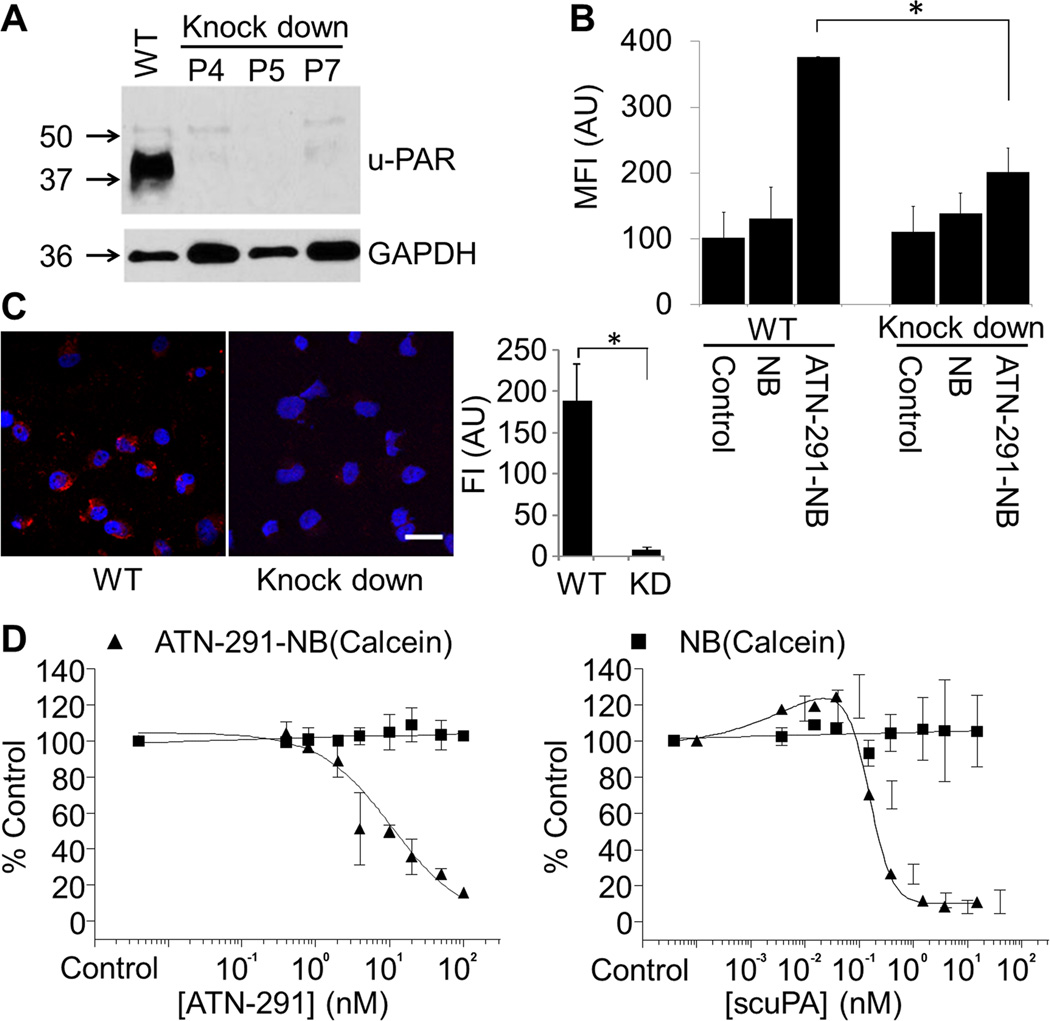
Figure 3. Cellular uptake of urokinase antibody (ATN-291) conjugated nanobin (NB) is u-PAR dependent.
A, Immunoblot analysis of u-PAR expression in wild-type (WT) and u-PAR shRNA stably-expressing (knock down, KD) ES-2 OvCa cells (passage number, P).
B, Flow cytometry of NB(Calcein) and ATN-291-NB(Calcein) uptake in ES-2 WT and KD cells (24 h). Control, no treatment. *, p value< 0.05. Bars represent means ± SEM from 3 independent experiments. Statistical analyses were performed using a two-tailed t-test.
C, Confocal microscopy analysis of Alexa647 (Red) labeled ATN-291-NB(NaCl) uptake in ES-2 WT and KD cells (24 h). Merged pictures of Alexa647 (red) and Hoechst (nucleus, blue) are shown. Scale bar, 20 µm. Quantification of AF647 fluorescence intensity (right).
D, Competition assays. HeyA8 cells were pre-treated with the indicated concentrations of uPA antibody ATN-291 (left) or with the single chain uPA (scuPA) (right). Subsequently 25 µM of ATN-291-NB(Calcein ▲), or as control NB(Calcein ■) was added for 24 h and cells analyzed by flow cytometry. The results were normalized to cells without ATN-291 or scuPA treatment. Bars represent means ± SEM from 3 independent experiments.

