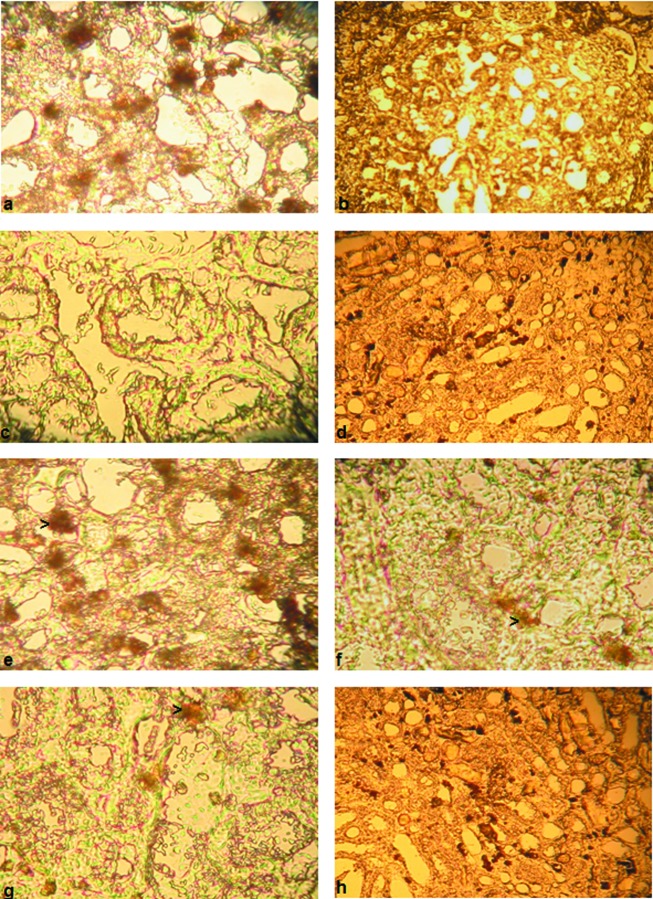
Figure 1 .
(a, b) Bcl2 and TNF-α expression in renal tubules of the sham group. (c) Expression of Bcl2 after renal IR. The lesser degree of Bcl2 expression in tubular epithelial cells of IR group. Magnification × 40. (d) Expression of TNF-α after renal IR. Increased TNF-α expression in tubular epithelial cells of IR group. Magnification ×20. (e) Expression of Bcl2 after MEL administration. Increased Bcl2 expression in tubular epithelial cells of MEL group compared to IR group. Magnification × 40. (f) Expression of TNF-α after MEL administration. Decreased TNF-α expression in tubular epithelial cells of MEL group compared to IR group. Magnification ×40. (g) Expression of Bcl2 after EPO administration. Minimal increased Bcl2 expression in tubular epithelial cells of EPO group compared to IR group. Magnification × 40. (h) Expression of TNF-α after EPO administration. Lesser decreased TNF-α expression in tubular epithelial cells of EPO group compared to IR group. Magnification ×20.

