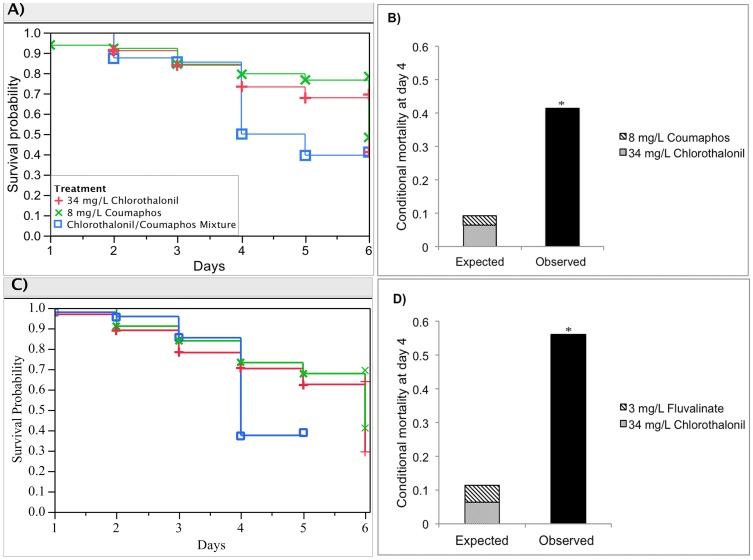
Figure 2. Synergistic interactions for two pairs of pesticide mixtures:
8 mg/L Coumaphos, 34 mg/L Chlorothalonil and the mixture; 3 mg/L Fluvalinate, 34 mg/L Chlorothalonil and the mixture. (A) and (C) show the respective Kaplan-Meier survival plots for honey bee larvae reared for each pair of pesticide mixture; (B) and (D) illustrate the interaction determination based on the deviation of observed mixture toxicity (black bar) from the expected additive toxicity (stacked bar). Asterisks denote significant difference from the expected additive toxicity (Mann–Whitney test, p<0.0001).

