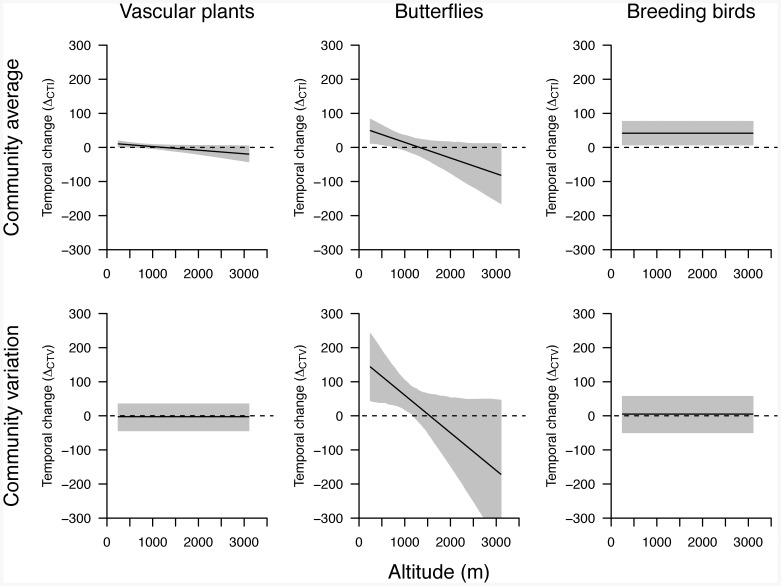
Figure 2. Temporal change of temperature indices of plant, butterfly and bird communities.
Given are model predictions for temporal changes of community average of temperature indices ( , upper panels) and of community variation in temperature indices (
 , lower panels) between two surveys at a sample square i separated by five years within the period 2003–2010, across the altitudinal range covered in the Swiss national biodiversity monitoring program. Black lines are regression lines from minimal adequate linear models, and grey areas represent bootstrapped 95% confidence intervals. Predicted values with confidence intervals that do not include zero are judged as being significantly different from zero.

