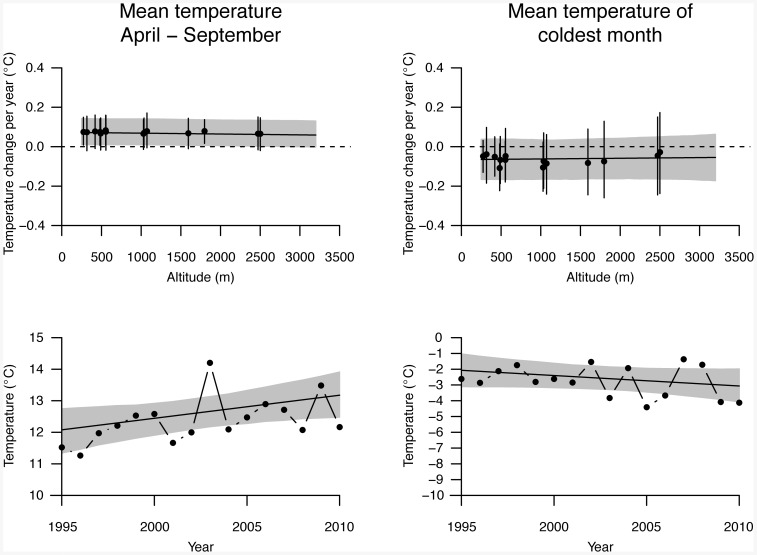
Figure 3. Temporal trends of air temperatures.
Upper panels present temporal changes in mean temperatures for summer half-years (April to September, left panel) and for the coldest month (right panel) for the years 1995–2010 as depending on altitude. Points represent linear changes of temperatures over years, given in °C per year, for 14 meteorological stations distributed over Switzerland. Error bars are 95% confidence intervals, and grey areas represent 95% confidence intervals of the linear mixed model predictions for the average trend of temperature over years (solid line). Lower panels present mean temperatures for summer half-years (April to September, left panel) and for the coldest month (right panel). Solid lines indicate temporal trends as estimated from linear mixed models, and grey areas represent 95% confidence intervals of the model predictions.

