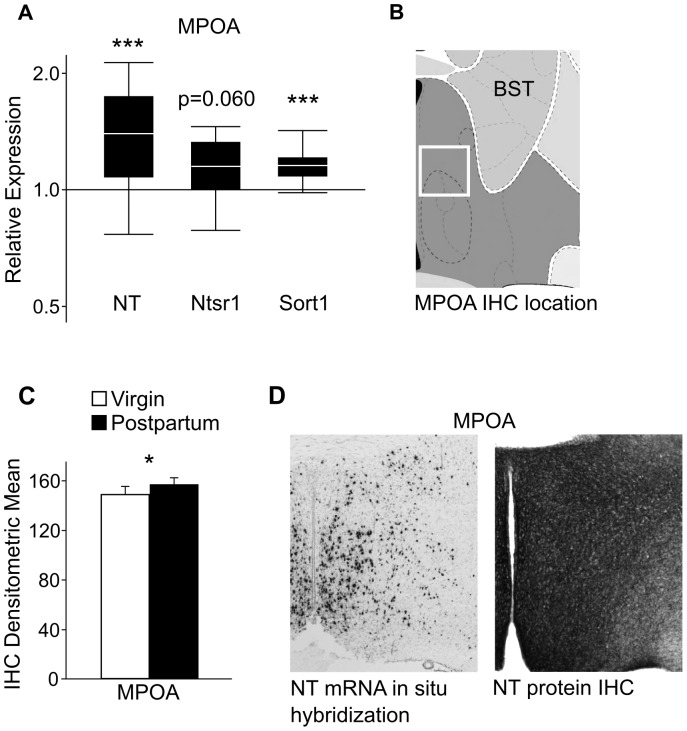
Figure 1. qPCR and IHC results for NT and NT receptor expression changes in the MPOA.
(A) Relative expression (y-axis) represents a ratio of gene expression in postpartum versus virgin females, with ratios over one indicating genes that have higher expression in lactating females. The box whisker plots demarcate the range (whiskers), interquartile range (box), and median (solid white line) for each gene tested. qPCR revealed significant up-regulation of NT and Sort1 in the postpartum MPOA, with a nonsignificant increase in Ntsr1. Sample size: 6 virgin and 8 postpartum females. (B) The white box outlines the area of the MPOA examined for NT peptide expression. Image modified from the Allen Mouse Brain Atlas. (C) A one-way ANOVA revealed a significant elevation in the density of NT peptide labeling in the MPOA of postpartum versus virgin females. Sample size: 7 virgins and 9 postpartum females. (D) Many cell bodies in the ventral and medial portion of the MPOA contain NT mRNA (left panel). Image modified from the Allen Mouse Brain Atlas. Dense NT peptide labeling is found throughout the MPOA (right panel), suggesting that NT peptide may be transported into the MPOA from other regions. * p<0.05; *** p<0.005. BST = bed nucleus of stria terminals.

