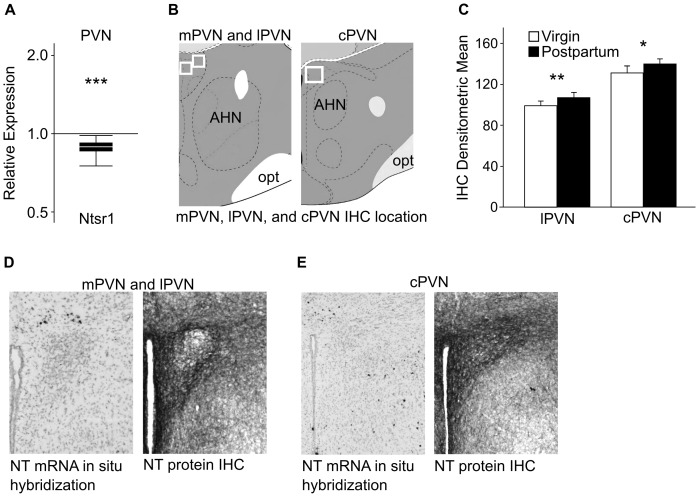
Figure 2. qPCR and IHC results for NT and NT receptor expression changes in the PVN.
(A) Relative expression (y-axis) represents a ratio of gene expression in postpartum versus virgin females, with ratios under one indicating genes that have lower expression in lactating females. The box whisker plots demarcate the range (whiskers), interquartile range (box), and median (solid white line) for each gene tested. qPCR revealed significant down-regulation of Ntsr1 in postpartum versus virgin females. Sample size: 7 virgin and 7 postpartum females pooled from a total of 14 individuals for each group. (B) The white box outlines the areas of the PVN examined for NT peptide expression. Images modified from the Allen Mouse Brain Atlas. (C) A one-way ANOVA revealed a significant elevation in the density of NT peptide labeling in the lPVN and cPVN of postpartum versus virgin females. Sample size: 7 virgins and 8 postpartum females for lPVN, and 7 virgins and 7 postpartum females for cPVN. (D–E) Very few cell bodies that contain NT mRNA are found in certain subregions of the PVN (D and E, left panels). Images modified from the Allen Brain Atlas. NT peptide IHC revealed dense staining of fibers in the mPVN and cPVN (D and E, right panels), and moderate staining in the lPVN (D, right panel). This suggests that NT peptide is transported into the PVN for release. * p<0.05; ** p<0.01; *** p<0.005. AHN = anterior hypothalamic nucleus, opt = optic tract, lPVN = lateral PVN, mPVN = medial PVN, cPVN = caudal PVN.

