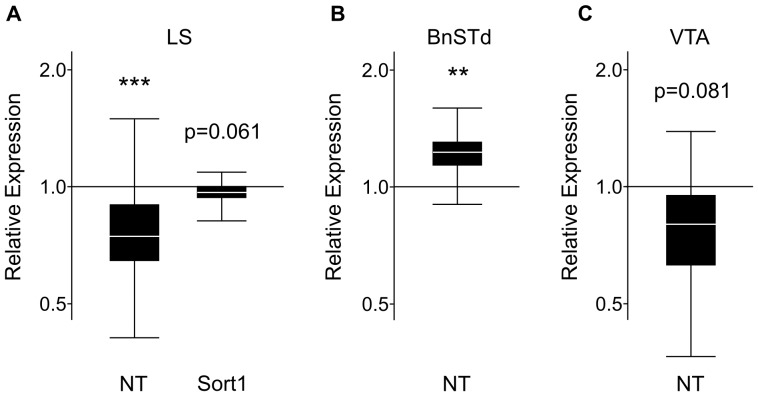
Figure 3. Results of qPCR analysis of NT and NT receptors in the LS, BnSTd, and VTA.
Relative expression (y-axis) represents a ratio of gene expression in postpartum versus virgin females, with ratios under one indicating genes that have lower expression in lactating females. The box whisker plots demarcate the range (whiskers), interquartile range (box), and median (solid white line) for each gene tested. (A) In the LS, NT mRNA expression was significantly down-regulated in lactating females, and there was a nonsignificant decrease in Sort1 expression in postpartum females compared to virgin females. Sample size: 10 virgins and 11 postpartum females. (B) In the BnSTd, NT was significantly up-regulated in postpartum compared to virgin females. Sample size: 7 virgin and 7 postpartum females pooled from a total of 14 individuals from each group. (C) In the VTA, NT was nonsignificantly down-regulated in lactating females versus virgins. Sample size: 7 virgin and 7 postpartum females. * p<0.05; ** p<0.01; *** p<0.005.

