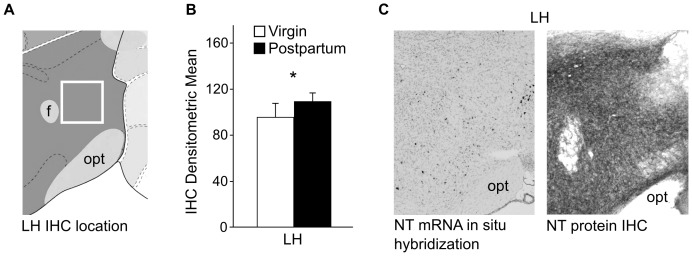
Figure 4. IHC results for changes in NT peptide expression in the LH.
(A) The white box outlines the area of the LH examined for NT peptide expression. Image modified from the Allen Mouse Brain Atlas. (B) A one-way ANOVA revealed a significant elevation in the density of NT peptide labeling in the postpartum LH compared to virgin females. Sample size: 7 virgins and 8 postpartum females. (C) Few cell bodies that contain NT mRNA are found in the LH (left panel). Image modified from the Allen Brain Atlas. NT peptide IHC revealed dense staining of fibers in the LH (right panel). * p<0.05. f = fornix, opt = optic tract.

