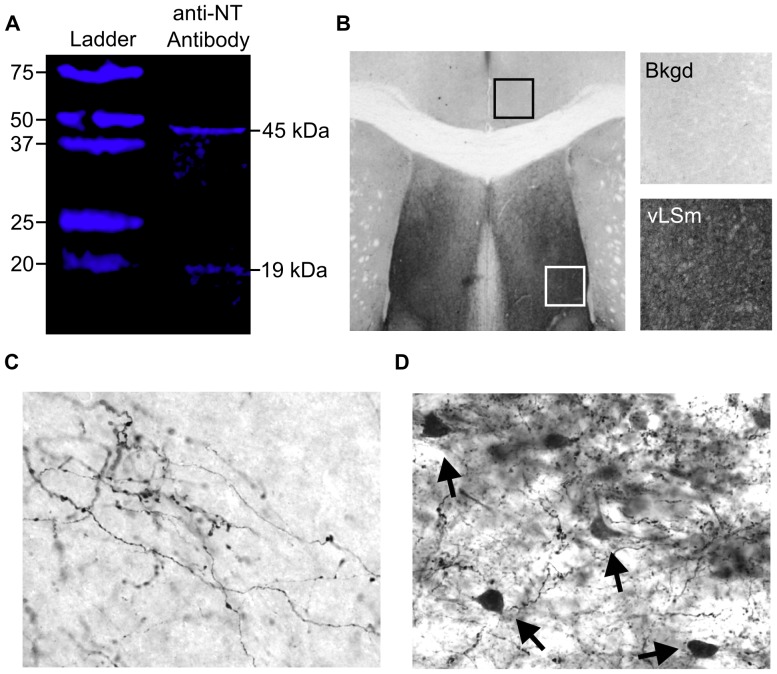
Figure 5. Images from a near infrared western blot and immunohistochemical staining using an anti-NT antibody.
(A) Bands were visualized at approximately 19 kDa, which corresponds with the molecular weight of the neurotensin/neuromedin N precursor protein, and at approximately 45 kDa. The identity of the protein weighing 45 kDa is unknown. (B) Example of the normalization method used to control for differences in background labeling. Background staining was relatively low across all sections analyzed (black square and top right panel), and was subtracted from the densitometric mean of regions of interest, such as the vLSM (white square and bottom right panel) in order to normalize brain sections analyzed. (C–D) NT staining was found in fibers and cell bodies (D, black arrows), which was expected. Regions labeled for NT were consistent with past immunohistochemical studies, suggesting that the antibody is specific to NT.

