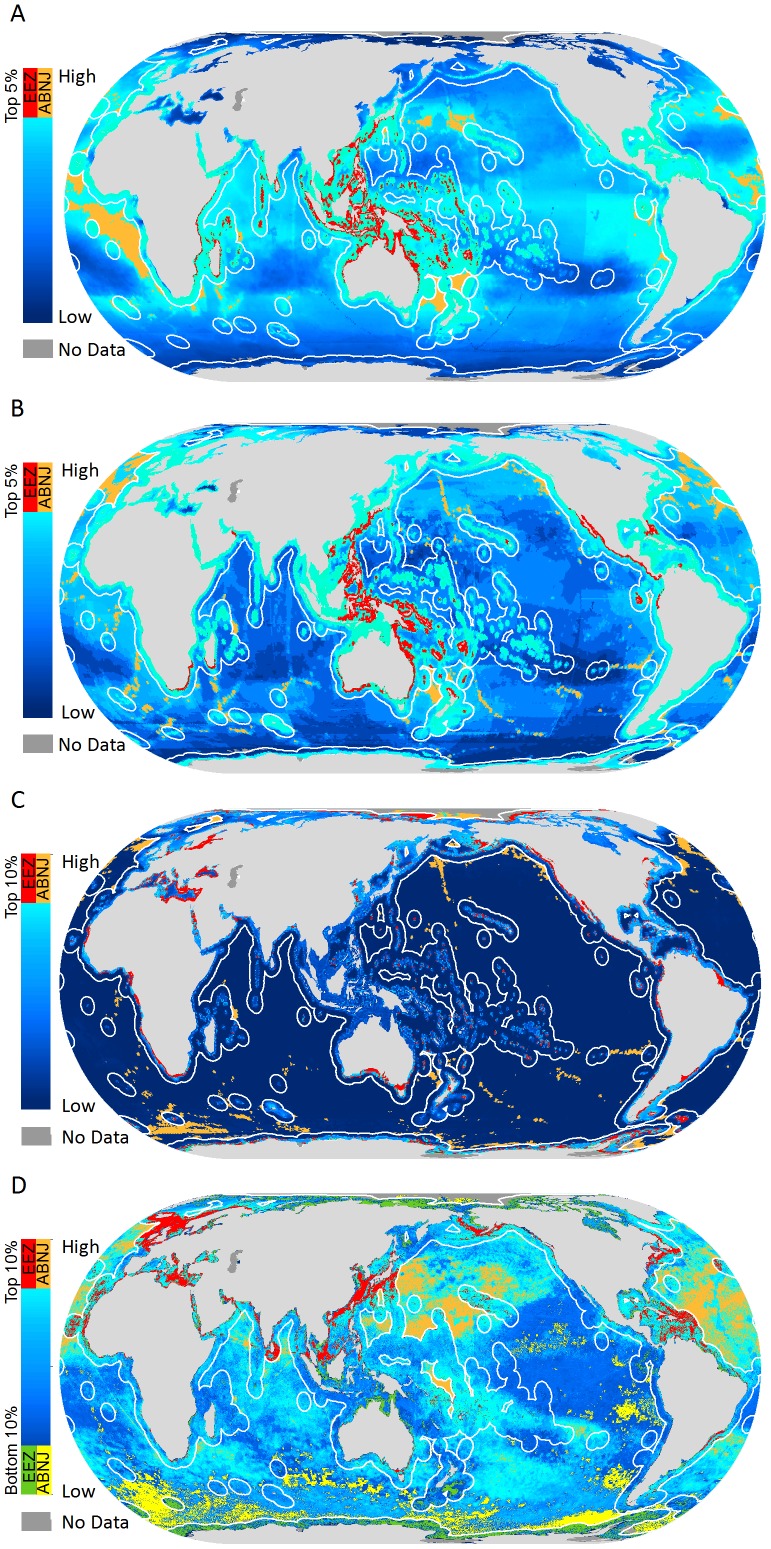
Figure 2. Spatial patterns for (A) species richness, (B) range rarity, and (C) proportional range rarity and (D) cumulative human impacts within EEZs and ABNJ.
The highest values for all diversity measures within 5% of EEZ or ANBJ area are also shown. Due to scale, not all values may be visible. EEZ boundaries are shown in white.

