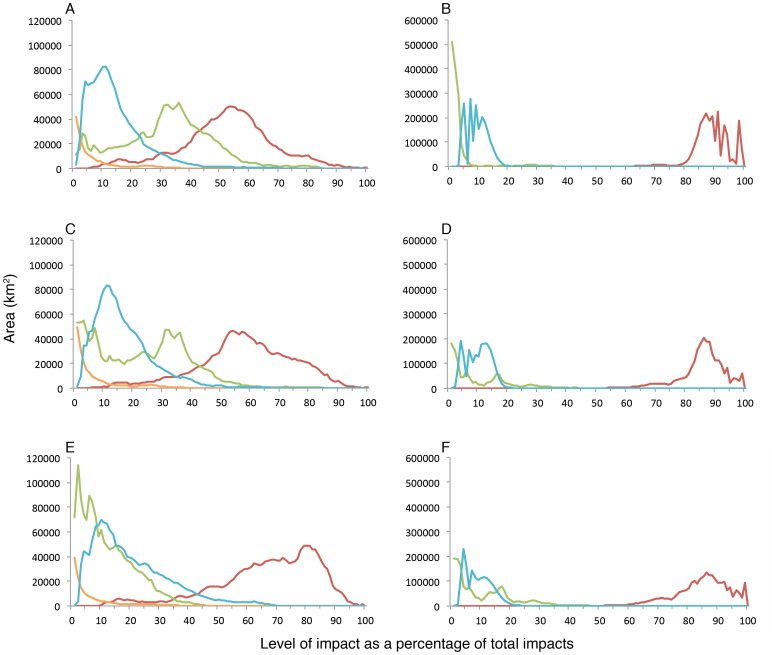
Figure 4. Intensity and extent of climate (red), fishing (green), ocean-based (blue) pollution, and land-based impacts (orange) as a percentage of total impacts within highly impacted priority areas.
Patterns are shown for priority areas that were designated based on (A) richness within EEZs (B) and ABNJ, (C) range rarity within EEZ and (D) ABNJ, and (E) proportional range rarity within EEZs and (F) ABNJ. Zero values are not shown.

