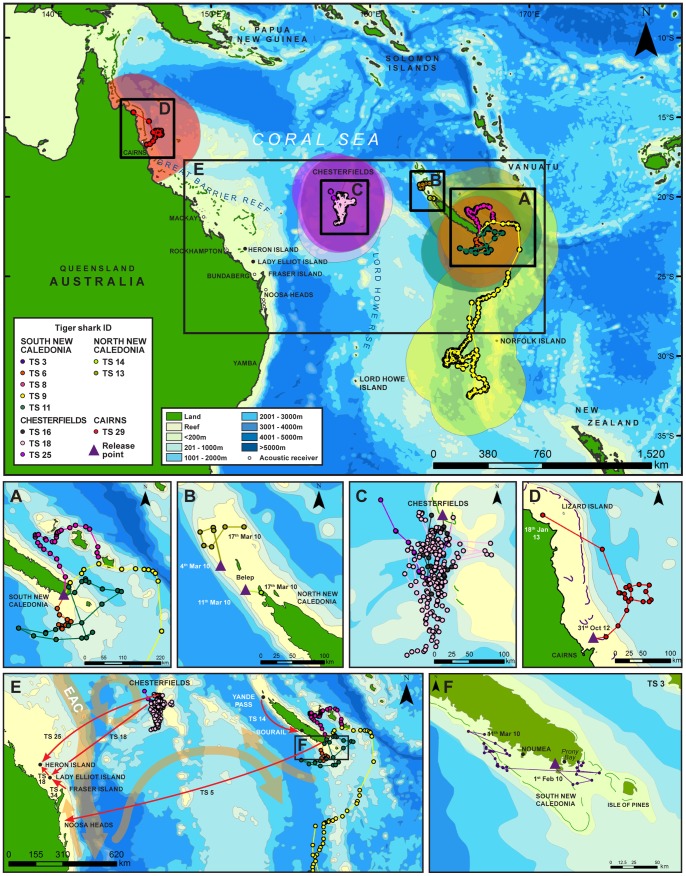
Figure 7. Spatial patterns of tiger shark movements across the Coral Sea between 2008 and 2013.
Bubble plots show 95% confidence interval envelope for PSAT tracks. (A) Satellite tracks of PSAT tiger sharks tagged in the Southern lagoon of New Caledonia; (B) SPOT satellite tagged tiger sharks in the north of New Caledonia; (C) PSAT tiger sharks in the Chesterfield Islands, and (D) off Cairns in the GBR. (E) Includes the straight distance between the first photo-ID spotting of TS5 in New Caledonia and the second on the east coast of Australia. (F) The movement of a juvenile TS in the south of New Caledonia. Red arrows indicate movements from point of release to detection on spatially separated array for tiger sharks with acoustic tags. Orange arrows indicate generalised patterns/directions of major currents within the region of tiger shark migration. EAC refers to the East Australian Current.

