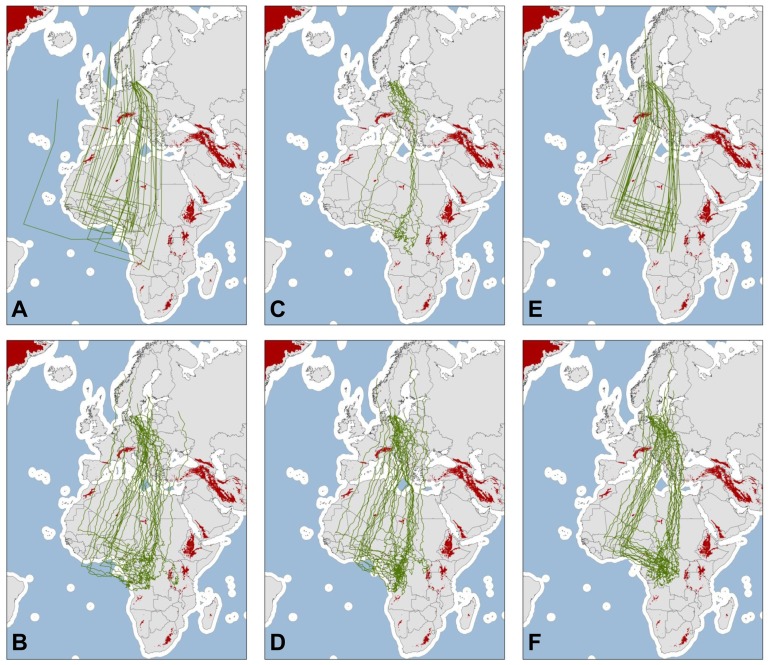
Figure 2. Maps showing examples of 15 random migration routes simulated by vector summation in six different ways.
A: simulations using the LONG model, B: SHORT, C: SHORT_Mort, D: SHORT_Dir_Change, E: LONG_Juv_Mort, F: SHORT_Juv_Mort (see Table 1). Blue parts of maps indicate water bodies considered a barrier (>200 km from the coast) and red parts indicate mountain barriers (more than 1700 m above sea level). Mercator projection.

