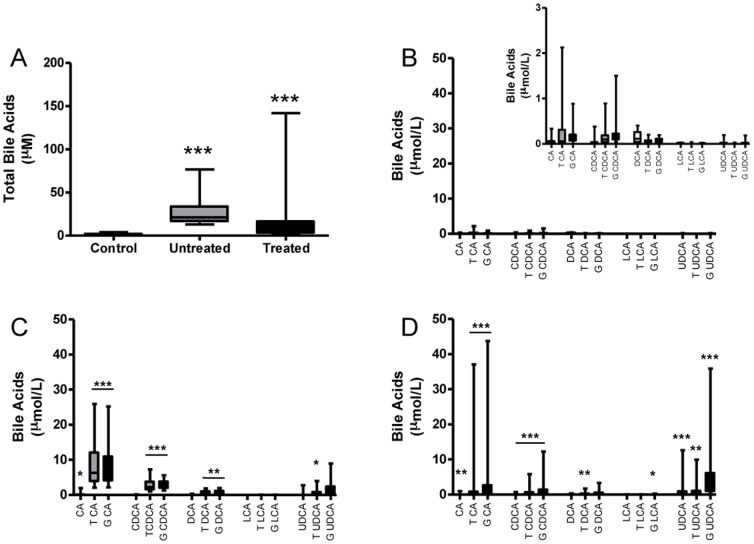
Figure 1. Total serum bile acids and HPLC-MS/MS analysis of bile acid profiles in maternal serum.
Total serum bile acids in control, untreated ICP and UDCA-treated ICP maternal serum (A). Maternal serum bile acid profiles in normal (B), untreated ICP (C) and UDCA-treated ICP pregnancies (D). In panels B–D, the serum bile acid level is shown using equivalent Y-axes in each group. However, given the significantly lower levels of bile acids in control serum the inset panel demonstrates these data using a smaller scale. * p = <0.05, ** p = <0.001, *** p = <0.0001. Panel C comparisons vs. control, panel D comparisons vs. untreated ICP.

