
Figure 4. Transplacental total bile acid gradients in ICP cases and controls.
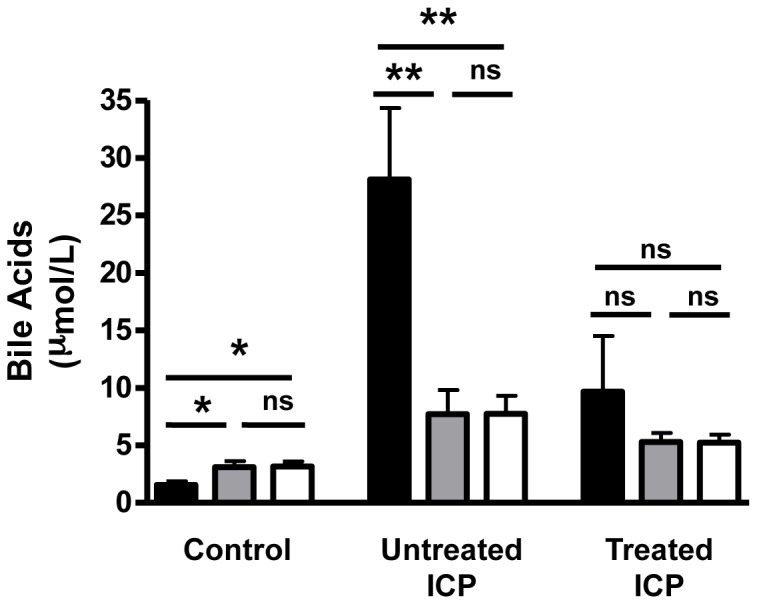
Graphs representing the differences in the levels of total bile acids between maternal, umbilical cord artery and vein serum samples from normal (A) (n = 15), untreated ICP (B) (n = 7) and treated ICP (C) (n = 5) pregnancies. Black bars = maternal samples, grey bars = umbilical cord vein samples, white bars = umbilical cord artery samples. * p = <0.05, maternal total bile acid vs. cord artery total bile acid and cord vein total bile acid. ** p = <0.005, maternal total bile acid vs. cord artery total bile acid and cord vein total bile acid. ns = not significant.