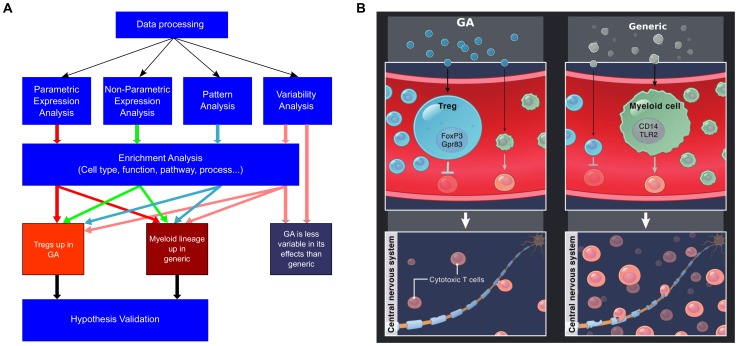
Figure 5. Flow chart of process for comparing a branded medicine to a generic, and model of key differences between GA and generic.
(A) Overview of the methods for analyzing gene expression data to compare the immunological impact of GA to that of generic. After processing, direct differences are identified by multiple parametric methods, non-parametric methods, as well as ANOVA-based pattern analysis, and variability analysis. The genes identified by these methods are analyzed using a variety of enrichment-based methods, which result in hypotheses that are then verified through additional methods. (B) The key hypotheses emerging from our studies involve the greater heterogeneity in the generic’s biological impact compared to GA’s, and the fact that GA appears to more effectively upregulate FoxP3 expression and promote tolerance-inducing Tregs, while generic appears to upregulated myeloid lineage cells such as monocytes and macrophages which may impair tolerance. Given these findings, it is reasonable to hypothesize that GA may suppress harmful cytotoxic cells more effectively than generic, and this hypothesis warrants further investigation.

