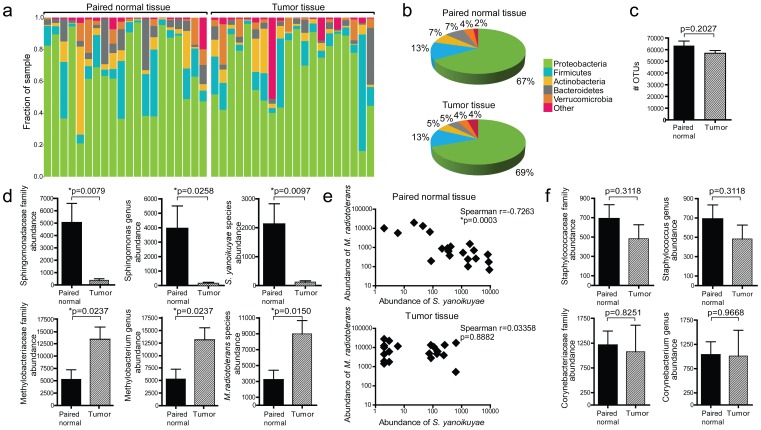
Figure 1. Survey of microbial communities residing in breast tissue from breast cancer patients.
A) Phylum level distribution of microbial communities comparing paired normal adjacent (“paired normal”) and breast cancer tissue from 20 patients with ER-positive breast cancer (n = 20). Each bar represents 100% of the bacteria detected in a given sample. B) Combined distribution at the phylum level in paired normal and breast tumor tissue (n = 20). C) Number of OTUs found in each community (n = 20). D) Analysis of OTUs with differential abundance between paired normal and tumor tissue (n = 20). E) Correlation of relative abundances of M. radiotolerans and S. yanoikuyae (n = 20). F) Relative abundances of commonly found skin bacteria (n = 20). p-values from Student’s paired t-test are shown, with P<0.05 considered significant. Error bars represent mean ± s.e.m.

