
Figure 7.
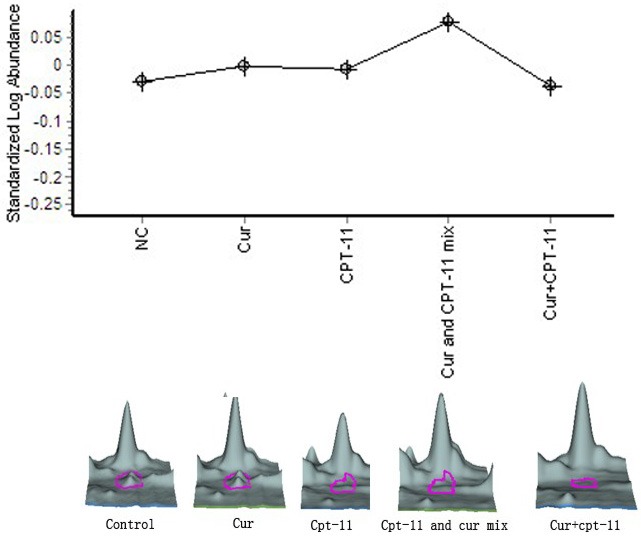
Protein disulfide-isomerase. These five Pictures above are changing curves and three-dimensional maps of five interesting spots selected in this study in different groups, diagram showing the various trends under different treatments, in which the three-dimensional map marked by red arrows and pink circles are interesting proteins.