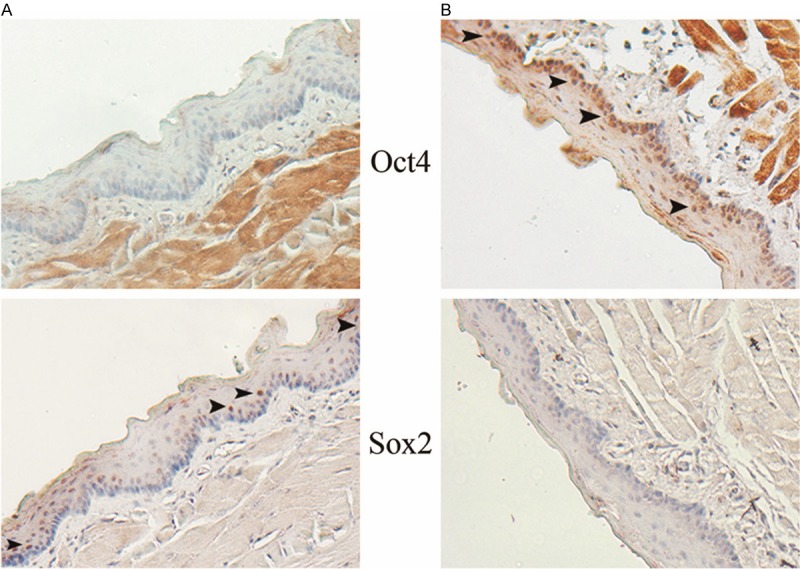
Figure 2.

The expression profile of Oct4 and Sox2 in normal oral mucosa of rat samples. Under one selected field of microscope (×160), Oct4 and Sox2 nuclear positive cells are individually detected in different cases, respectively. The arrow heads show the locations of these positive cells are basal layers.
