
Figure 3.
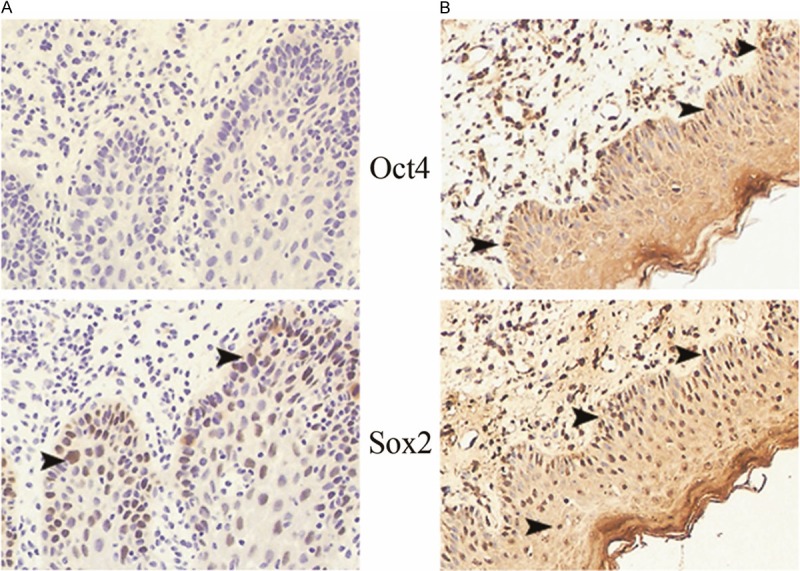
The expression profile of Oct4 and Sox2 in precancerous lesions of human samples (×160). A: A representative sample of the expression profile of Oct4 and Sox2 in OLK. Under one selected field of microscope, nuclear positive cells of Sox2 are demonstrated (arrow heads). The expression of Oct4 is negative. B: A representative sample of the expression profile of Oct4 and Sox2 in OLP. Under one selected field of microscope, Oct4 and Sox2 double positive cells (Oct4+Sox2+) are noted (arrow heads).