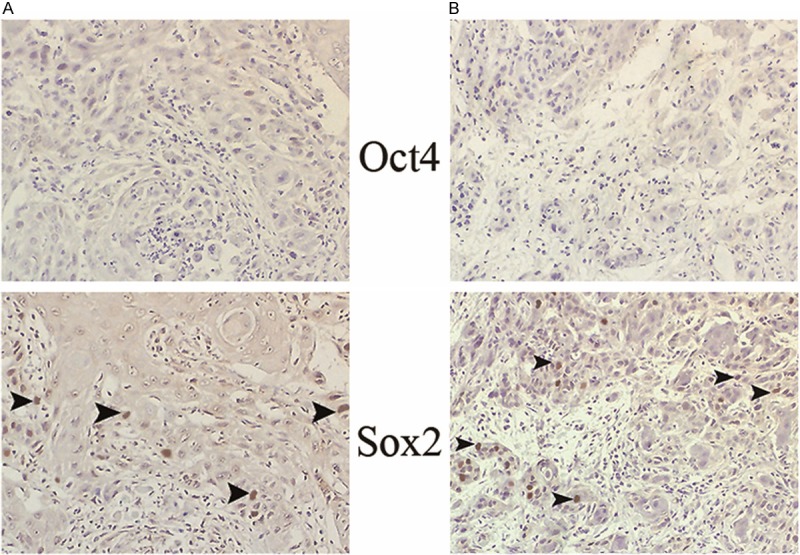
Figure 6.

The expression profile of Oct4 and Sox2 in a paired OSCC (moderate differentiation). Sox2 single positive pattern in the primary site (A) and in the metastatic site (B) are noted, respectively. All the positive cells are demonstrated by arrow heads in the magnification of ×160.
