
Figure 5.
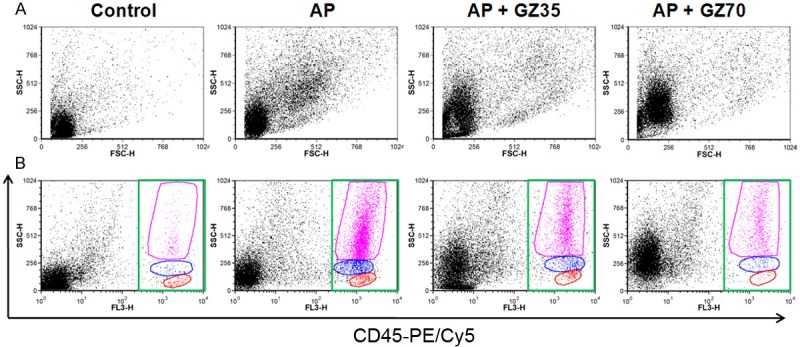
Flow cytometry analysis of inflammatory cells in pancreas of mice with AP. A: Representative forward and side scatter plot for isolated cell in the AP group. B: CD45/SSC gating was used to identify various leukocytes populations in the AP group. Green rectangle gate shows leukocytes population. Pink, blue and red gates show granulocytes, monocyte and lymphocyte population, respectively. Representative plots from 6-8 mice are shown.