
Figure 6.
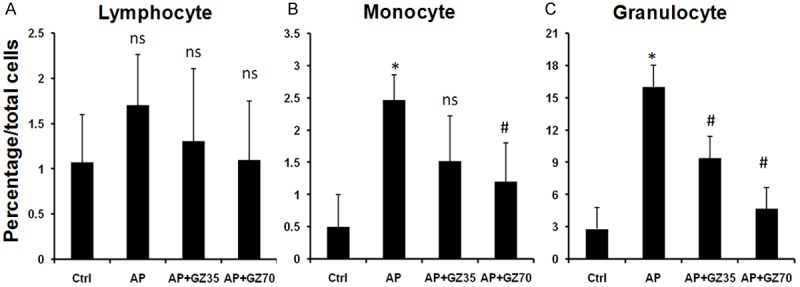
Quantifying the percentage of all inflammatory cells by flow cytometry. Inflammatory cells were determined as stated in Figure 5B and the percentage of each cell population was analyzed by dividing the number of each population to total of isolated pancreatic cells. The percentage of lymphocytes, monocytes and granulocytes are shown in graphs A, B and C, respectively. Pooled data from 6-8 mice per group are shown. Values are the mean percentage of each population ± SD. *P<0.05; ns: non-significant. *P<0.05 compared with the control mice; #P<0.05 compared with the AP group; ns; non-significant.