
Figure 1.
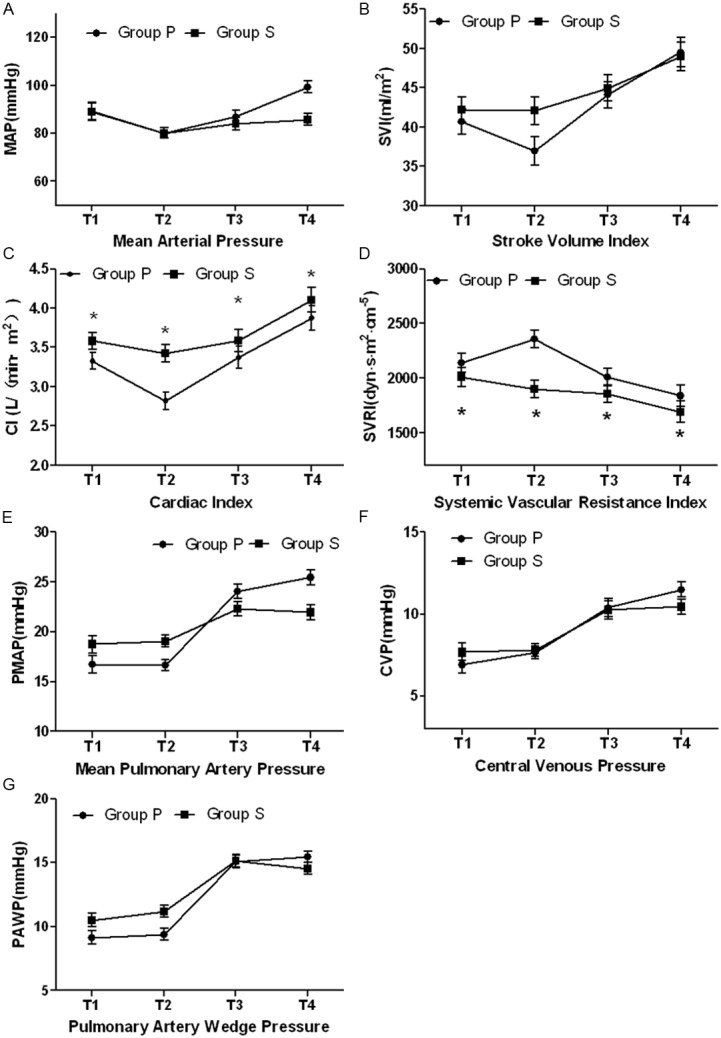
Changes in hemodynamic data at after anesthesia induction (T1), two lung ventilation (T2), one lung ventilation (T3) and the end of the operation (T4) in propofol group and sevoflurane group. A was mean arterial pressure (MAP), B was stroke volume index (SVI), C was Cardiac index (CI), D was stroke volume index (SVI), E was mean pulmonary artery pressure (PMAP), F was central venous pressure (CVP), G was pulmonary artery wedge pressure (PAWP). The values for MAP (P=0.140), SVI (P=0.369), PMAP (P=0.790), CVP (P=0.899), and PAWP (P=0.203) did not significant differ between two groups. CI was significantly smaller in propofol group than in sevoflurane group throughout the surgery (P=0.007). SVRI was significantly greater in propofol group than in sevoflurane group (P=0.022). *P<0.05 between groups.