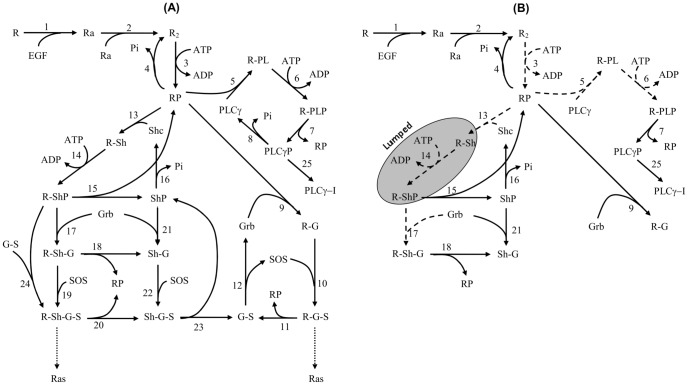
Figure 6. The EGFR biochemical network.
A solid arrow represents a reaction with two kinetic parameters and a dashed arrow represents a reaction with one kinetic parameter. (A) The full network from [25], (B) The optimal network to produce the dynamics of the five target components for any experimental condition  in (22).

